Biography
Interests
Motaz Alawna1*, Bayram Unver2 & Ertugrul Yuksel2
1Department of Physical Therapy, Faculty of Allied Medical Sciences, The Arab American University (AAUP),
Jenin Palestine
2Department of Orthopedics Physiotherapy, Faculty of Physical Therapy and Rehabilitation, Dokuz Eylül
University, Izmir-Turkey
*Correspondence to: Dr. Motaz Alawna, Department of Physical Therapy, Faculty of Allied Medical Sciences, The Arab American University (AAUP), Jenin Palestine.
Copyright © 2019 Dr. Motaz Alawna, et al. This is an open access article distributed under the Creative Commons Attribution License, which permits unrestricted use, distribution, and reproduction in any medium, provided the original work is properly cited.
Abstract
Star excursion balance test (SEBT) can be used in different fields to asses balance and postural control, but no sufficient information about how the predictive factors (height, leg length, gender, weight and habits) can affect the performance of the SEBT. To determine if the predictive factors (height, leg length, gender, weight and habits) effect or interfere with the performance of the SEBT. 74 healthy participants, 37 male, 37 female The SEBT was performed three times by each participant. 5 min rest was given after each attempt. The SEBT, the reaching distance in each of the eight directions was labelled and measured after completing each attempt. Strong correlations were found between, Dominant leg length (stance leg), nondominant leg length (swing leg), height, weight, gender and reaching distance in all of the reaching directions This study demonstrates the various predictive factors (Height, stance leg length, swing leg length, weight, and gender) must be taken in consideration during the performance of the SEBT. As this factors affect the performance of the SEBT strongly.
Introduction
Postural control assessment is a very important process to assess the neuromuscular function in different
fields, like pediatric, geriatric, and athletic populations [1], the Star Excursion Balance Test (SEBT) is one
of the dynamic balance tests that require good strength, flexibility, and proprioception [2,3]. It is important
to say, that the SEBT test detect a great amount of information’s about instability in shortest time [3].
SEBT is a test that provides a big challenge for the postural control system [4-7], (Gray, 1995, Miller, 2001), also it is a reliable and valid instrument for the assessment of dynamic postural control [5-7] (Gray, 1995). Dynamic lower extremity reaching tests, such as the SEBT, show a promise for clinical screening of athletes dynamic postural control [8]. Previous studies showed that, the reduction in postural control and the lower extremities risk of injury can be predicted by using the SEBT [9].
There are a lot of predictive factors that can affect the performance of the SEBT. Lower extremities musculoskeletal injuries, (ankle ligaments injuries, anterior cruciate ligament injuries, patellofemoral joint problems) [7], strength, dorsiflexion range of motion, plantar cutaneous sensation, ankle eversion strength, static postural control [10], also neuromuscular training, and core stability exercises (Alayso et al. 2015). Another studies found that sport participation and sport type are contributing factors that affect the performance of SEBT, as they found differences between high school and collegiate athletes, also differences between athletes who practice a different types of sport during the performance of the SEBT [8,11-14]. Age also has been suggested to be a predictive factor that affects the performance of SEBT too [14-19], however they reported that less than 10% of the variances in the SEBT test are related to the variances in age and height.
The effects of mental status, foot type, and muscle strength on the performance of the SEBT also have been studded [20,21].
Some predictive factors have been studded by Phillip et al (2012) [22], they found a correlation between height, leg length, gender and reaching distance during performance of the SEBT. Leg length has stronger correlation, and males have a greater reaching distance, also they found that there is no significant relations between foot type, ROM (ankle dorsiflexion), and reaching distance of SEBT [23].
There is a need to develop a low coast and reliable assessment tool to predict the risk of injury and as the SEBT is one of the tests that used to predict lower extremities injuries [9], all predictive factors should be study in details to consider any variations that can affect the performance of the SEBT.
As the literature don’t provide sufficient information about the effect of predictive factors on the performance of the SEBT. The purpose of this study was to examine the correlations between Height, Dominant leg length (stance leg), nondominant leg length (swing leg), weight, gender, habit (Smoking, exercise and Alcohol) and reaching distance during performance of SEBT, as weight and habits hadn’t been studded before, also to test the differences between males and female during the performance of SEBT.
Methods
Before startıng thıs study power test was done to determıne the number of partıcıpant of thıs study. 74
Healthy volunteers (37 male, 37 female) were participated in this study. Participant’s age rang was 18 -
30 years old and participants were recruited from university population. Participant were excluded if he/
she reports (a) previous low back, hip/pelvis, knee, ankle, or foot surgery within the past year; (b) lower
extremity amputation; (c) injury to the lower extremities or low back in the previous six months; (d) known
balance impairment due to neurological disorder, vestibular disorder, medication use, or other; (e) currently
undergoing treatment for inner ear, sinus, head cold, or upper respiratory infection; (f) pregnancy; or (g)
concussion within the previous three months (h) if the participant is professional athlete. Participant’s
descriptive data are presented in (Table 1). Standard clinical stability testing of the ankle ligamentous
structures was performed in order to rule out anterior and lateral talocrural joint instability and lower
extremity injuries during the previous 6 months. Each volunteer signed an informed consent form prior to
participation. The study was approved by Dokuz Eylul University ethics committee.
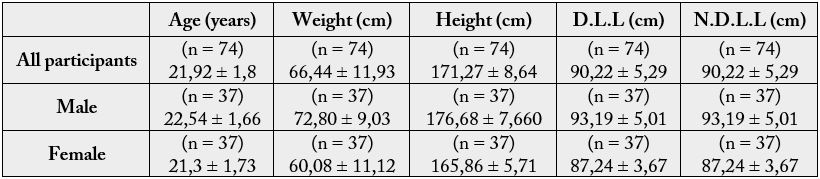
D.L.L: Dominant leg length;
N.D.L.L: Nondominant leg length
Leg length was measured (right and left leg) while participant lying supine, from the anterior superior
iliac spine to the inferior border of the ipsilateral medial malleoli by using standard measure tape, height
was measured by using standard height chart, and weight was measured by using an electronic weighing
machine. The volunteers was asked about using alcohol, doing sport or smoking, if they were doing sport not
less than 3 times per week 30 minutes for each time considered as a habit [24]. According to the National
Institute of Alcohol Abuse and Alcoholism (NIAAA), if the participant used to drink 7 drinks of alcohol
peer week they considered as alcoholism. Also they asked if they are smoker or not. Dominant leg (stance
leg) was determined according to Vauhnik [25] & ark. modified version. The limb that was used in at least 2
of the 3 following activities: (1). Kicking a ball, (2). Drawing a diamond figure on the ground and (3).using
his leg and step over a spider toy, was considered as the dominant leg.
8 strips of athletic tape with a length of 6 foot were used. Then a ‘+’ sign were formed. Then ‘x’ sign were
formed with the other two strips. The lines were separated from each other by an angle of 45°. The participant
were asked to wear a sport clothes and take of the shoes, then to step on the center of the grid formed by
eight lines using the dominant leg, the plantar aspect of the first metatarsophalangeal joint (ball of the foot)
was positioned on the intersecting lines at the center of the grid to maintain consistency in foot placement.
The participant start to reach as possible as far in the eight lines, make a light touch on the line, and return
the reaching leg back to the center, while maintaining a single-leg stance with the other leg in the center
of the grid, starting from anterior direction and progressing clockwise. The order of the directional reaches
was as follows: A, AM, M, PM, P, PL, L, AL. When reaching in the lateral and posterolateral directions,
participants must reach behind the stance leg to complete the task.
The participant practices 6 attempts to reduce the learning effect [5], then after 5-min of rest period participant performed 3 trials in each of the 8 directions, 5-min of rest period was taken between each one of the three trials. The investigator recorded the reaching distance using standard tape measure by marking the tape as the distance from the center of the gird to the maximal reaching point. If the participant used the stance leg for a high amount of support, was unable to maintain balance on the stance leg or removing his feet from the center any time while doing the trial, the attempt was cancelled and repeated again. In the case of a rejected trial, verbal feedback was given to the participants so they attempt to correct the performance error(s) on the next trial.
SPSS 14.0 version for Windows was used for all statistical analyses. Correlation test were performed to test
the correlations between Height, Dominant leg length (stance leg), nondominant leg length (swing leg),
weight, gender, habit (Smoking, exercise and Alcohol) and reaching distance during performance of SEBT.
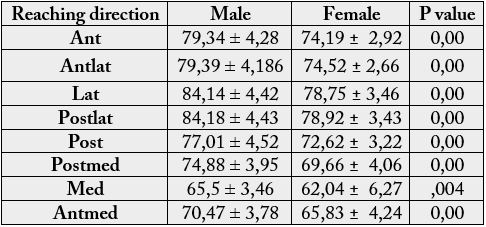
Independent T-tests were performed to compare the reaching distance between male and female groups,
(Table 2).
Repeated measures-ANOVA tests were performed to compare the reaching distance between the 8 directions.
Normalized data (normalization was performed by dividing each excursion distance by a participant’s leg length, and then by multiplying by 100) also were used to test the correlations between Height, Dominant leg length (stance leg), nondominant leg length (swing leg), weight, gender, habit (Smoking, exercise and Alcohol) and reaching distance during performance of SEBT, and to compare the reaching distance between male and female groups. Repeated measures-ANOVA tests were performed to compare the reaching distance between the 8 directions.
Results
By using the both raw and normalized data, the correlation test revealed no correlation between habits
(Smoking, exercise and Alcohol) and the reaching distance in all of the eight directions during the performance
the SEBT (p >.05). Strong correlations were found between, dominant leg length (stance leg), nondominant
leg length (swing leg), height, weight, gender and reaching distance in all of the reaching directions, when
Raw data was used, (p < .05) (Table 3). But no correlations were found by using the normalized data.
No differences were found in reaching distance between the dominant leg length and the nondominant leg length when using the both raw data and normalized data
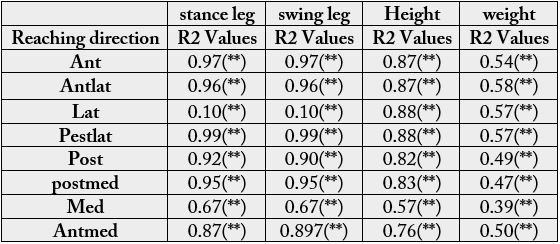
*p < .05. **p < .01. ***p < .001.
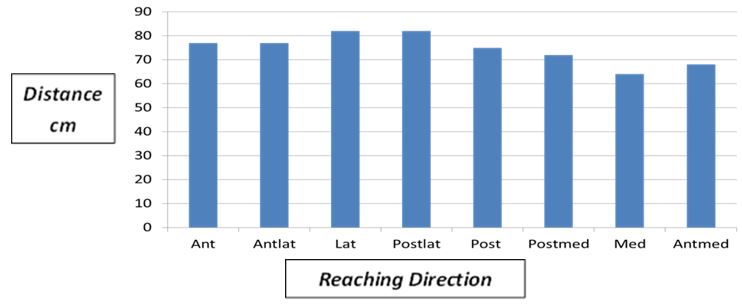
By using the raw data, the statistical analysis revealed that there was no significant difference in reaching distance between the anterior and anteriolateral directions, (p >.05). Also revealed that there was no significant difference in reaching distance between the lateral and posteriolateral directions, (p >.05) (Figure 1). But there were a significant difference in reaching distance between the other directions, (p < .05) (Figure 1). After normalizing the reaching distance to the leg length the statistical analysis revealed that there was no significant difference in reaching distance between all of the reaching distance directions.
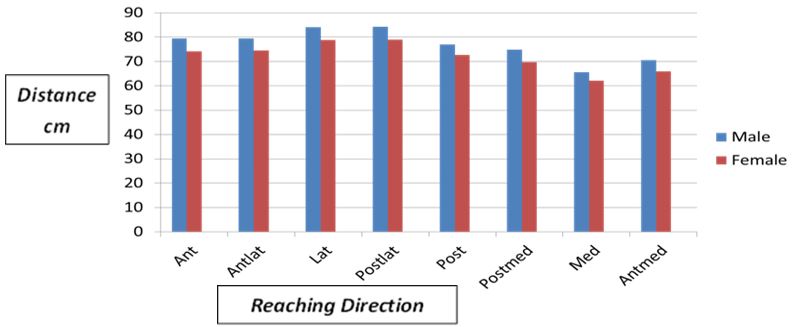
The dependent t tests revealed significant differences between male and female groups while using the raw data in all direction during performance of the SEBT (p < .05), (Table 2). But there were no significant differences between male and female groups in all the reaching directions when using the normalizing data (p >.05).
The best reaching direction for female group was the lateral and posteriorlateal directions and the least reaching direction was the medial direction. For male group the best reaching direction was the lateral and posteriolateral directions while the least reaching direction was the medial direction (Figure 2).
Discussion
In this study we investigated the effect of various predictive factors (Height, Dominant leg length (stance
leg), nondominant leg length (swing leg), gender, habit) on the performance of SEBT.
There were no studies found in the literature about the correlation between habits and reaching distance during the performance of SEBT. In our study there was no correlation found between habits (smoking, sport and alcohol) and the reaching distance during the performance of SEBT, this result refers to that our participants were young, healthy, active persons. And we didn’t studied the difference between healthy active persons and professional athletes, this result was expected, as some previous studies have studied this factor and had found some differences between high school athletes and colligate athletes and between the different types of sports during the performance of the SEBT [8,11-14].
To the researchers knowledge there were no studies than investigate the effect of weight on the performance of the SEBT, a strong correlation were found in our study between participant’s weight and reaching distance in all of the reaching directions (anterior, anteromedial, lateral, posteriolateral, posterior, posteromedial, medial, and anterolateral), a directly proportional correlation were revealed, that as the weight increases the reaching distance increases (Table 3). This result refers to that as the height and leg length increase the weight increases and because there were a proportional correlation between height, leg length and reaching distance we got this result. Also as the males mean height, and mean leg length was more than the females mean height and mean leg length, (Table 3) this result was obtained.
We found strong correlations between the dominant leg lengths (stance leg), nondominant leg length (swing leg), height, and reaching distance in all of the directions, (anterior, anteromedial, lateral, posteriolateral, posterior, posteromedial, medial, and anterolateral. These results refer to that as the person’s height and leg length increase, he can reach more (Table 3). Our results is in some agreement with the study that done by Phillip et al. (2003) [23], who demonstrate that there was a strong correlation between height, leg length and reaching distance in 6 of 8 directions (anterior, anteromedial, medial, posteromedial, posterior, and anterolateral) during the performance of SEBT. (Table 3). Also Butler et al 2012 [14]; Barela et al 2003 [15]; Forssberg et al 1982 [16]; Hirabayashi et al 1995 [17]; Steidle et al 2006 [18]; Wolf et al 1998 [19] had found some results that agrees with ours as they reported that less than 10% of the variances in the SEBT test is related to the variances in age and height.
In comparing the difference between male and female groups while using the raw data we found that there were a significant differences in all of the reaching directions (anterior, anteromedial, lateral, posteriolateral, posterior, posteromedial, medial, and anterolateral), during performance of SEBT between male and female groups. (Table 2). Due to males mean height, mean weight and mean leg length were more than the females mean height, mean weight and mean leg length (Table 3). These results are in some agreement with the results found by Phillip et al (2012) [22] who found that male can reach better than female in just three directions (posterior, posteriomedial and medial)
But when the reaching distance was normalized to the leg length there were no significant differences revealed, and this is because when the normalizing was done to the leg length the differences in reaching distances between male and female groups disappeared. This result agrees with Phillip et al (2012) [22] result who reveals the same result.
Participants were able to reach the most in the lateral and posteriolateral directions while reached the least in the medial direction, (figure 2). This result referred to that the range of motion of trunk lateral flexion is more than the range of motion of trunk extension so the participant was able to reach more in the lateral direction, also we can explain their least reaching in the medial side by saying that reaching to the medial side is so difficult because the range of motion of hip adduction is less than the range of motion of hip abduction and the stance leg limits the reaching of the swing leg to the medial side.
The excursion reaching distance normalization to the leg length is important, as we found that there is a significant difference while using the raw data to test the correlation between reaching distance and weight also to test the difference in reaching distance between male and female. But when we used the normalized date we found no correlation between weight and reaching distance and no significant difference between male and female.
As the leg length has the strongest correlation to the excursion reaching distance the normalization of data to the leg length should be considered when using the SEBT as an assessment tool. This result is in agreement with the results that have found by Phillip A. Gribble and Jay Hertel. (2003) [23].
Our study strength point was that we controlled the participants well, as they didn’t wear a shoe or socks and they were not professional athletes and we controlled the stability of ankle joint by testing the ligaments instability to assure the elimination of these factors effect during performance of the SEBT test [26].
The not counter balanced trials order was a potential limitation in our study as the order was in the clockwise direction. In future studies we recommend that the researchers should randomize the order to eliminate the effect of learning factor and fatigue [27].
Beside that our participant’s age range was narrow, so we recommend that the participant’s age range should be wider and to study another predictive factors like trunk ROM, trunk muscles strength, functional joint motion and muscle activation.
Conclusion
The SEBT is one of the most favourable tests that can be used in different field of rehabilitation like, pediatric,
geriatric, and athletic populations, to assess the postural control and the lower limbs musculoskeletal deficits.
The results of this study demonstrate the various predictive factors (Height, stance leg length, swing leg
length, weight, and gender) must be taken in consideration during the performance of the SEBT. As this
factors affect the performance of the SEBT strongly. Also the normalization of the excursion reaching
distance to the leg length should be taken in consideration while using the SEBT as an assessment tool.
Practical Aoolications
The results of this study demonstrate the various predictive factors (Height, stance leg length, swing leg
length, weight, and gender) must be taken in consideration during the performance of the SEBT. As this
factors affect the performance of the SEBT strongly. Also the normalization of the excursion reaching
distance to the leg length should be taken in consideration while using the SEBT as an assessment tool.
Bibliography


Hi!
We're here to answer your questions!
Send us a message via Whatsapp, and we'll reply the moment we're available!