Biography
Interests
Ying-Chih Wang1*, Jay Kapellusch1, Bhagwant Sindhu1, Leigh Lehman2, Xiaoyan Li3 & Sheng-Che Yen4
1Department of Occupational Science & Technology, University of Wisconsin-Milwaukee, Milwaukee, WI, USA
2Department of Occupational Therapy, Augusta University, Augusta, GA, USA
3Department of Physical Medicine and Rehabilitation, University of Texas Medical School at Houston, and
TIRR Memorial Hermann Research Center, Houston, TX, USA
4Department of Physical Therapy, Northeastern University, 360 Huntington Ave, Boston, MA, 2115, USA
*Correspondence to: Dr. Ying-Chih Wang, Department of Occupational Science & Technology, University of Wisconsin-Milwaukee, Enderis Hall 955, 2400 E Hartford Ave, Milwaukee, WI 53211.
Copyright © 2018 Dr. Ying-Chih Wang, et al. This is an open access article distributed under the Creative Commons Attribution License, which permits unrestricted use, distribution, and reproduction in any medium, provided the original work is properly cited.
Abstract
Lumbar spine impairments affect a substantial proportion of individuals.
Our purposes were to: (1) examine the psychometric properties of the 10-item modified Oswestry
Low Back Pain Disability Questionnaire (m-ODI) (0-100) questionnaire using the Rasch analysis,
(2) establish the percentile rank of an m-ODI score and (3) develop a functional staging approach
to guide clinical interpretation of the patient’s improvement by interpreting m-ODI scores.
Cross-sectional.
Outpatient rehabilitation clinics.
28,751 patients with orthopedic lumbar spine impairments seeking outpatient physical therapy in
652 clinics.
NA
We examined rating scale structure, item difficulty hierarchy, item fit, person-item match,
separation index, differential item functioning (DIF) by demographic variables, test precision, and
unidimensionality of the m-ODI. Additionally, we reported the percentile rank distribution and
applied the keyform approach to develop a functional staging.
Results showed that m-ODI questionnaire has adequate psychometric properties. Item ‘lifting’
appeared to be the most difficult item, followed by ‘pain intensity’ and ‘personal care” was the easiest
item. The coverage of m-ODI items matched well with the patient functional abilities. With a
separation index equaled to 2.10, the m-ODI items can differentiate persons into 3.1 statistically
distinct person strata. The m-ODI was free from DIF by gender and symptom acuity, but 3 items
exhibited DIF by age group. Factor analysis supported one-factor solution; nonetheless, the first
factor explained merely 48.6% of the total variance. We provided an example of functional staging
application.
Since this study was a secondary analysis of prospectively collected data, selection bias is inevitable.
Results supported the clinical usage of the m-ODI questionnaire in outpatient (orthopedic)
rehabilitation service.
Abbreviations
m-ODI = modified Oswestry Low Back Pain Disability Questionnaire
ICC = intraclass correlation coefficient
DIF = differential item functioning
Introduction
Lumbar spine impairments affect a substantial proportion of individuals. It is estimated that 2.06 million
people went to the emergency room for low back pain between 2004-2008 in the US, which approximates
3.2% of all emergency visits [1]. Low back pain is associated with abnormal alignment of vertebrae and
abnormal muscle, ligament and bone structures. Weakness or injury to any of the spine structures (e.g.,
sprains and strains, intervertebral disc degeneration, herniated discs, radiculopathy, spondylolisthesis,
traumatic injury, spinal stenosis, skeletal irregularities) at the lumbar region may cause functional disabilities
associated with lumbar spine impairments.
The Oswestry Disability Index (ODI) [2,3] also known as the Oswestry Low Back Pain Disability Questionnaire, is commonly used in both clinical and research settings to measure functional disability related to low back impairments. The questionnaire has been applied to patients with various etiologies [4-7] and in diverse settings (e.g. community-dwelling adults [8], registry database [9], outpatient patients) [10]. Presently, more than 27 versions of ODI adaptations have been applied in 24 different languages/cultures [11]. In particular, Fritz and Irrgang (2001) [4] have reported a modified version that replaces the item of ‘sex life’ with ‘employment/homemaking’. This modification emphasizes the aspect of activity/participation that is otherwise absent from the original ODI. Here, we abbreviated this modified version as m-ODI.
Previous studies have examined the reliability, validity, and sensitivity of ODI to changes of low-back functional disability. For example, moderate to high reliability coefficients have been reported in a number of studies including test-retest reliability (intraclass correlation [ICC] = 0.92 [12], 0.90 [4], 0.88 [13], 0.70) [14], intrarater reliability (ICC = 0.93) [15], and internal consistency (Cronbach’s alpha = 0.97 [15], 0.96 [12], 0.88 [13], 0.85 [10], 0.82 [14], 0.78) [16]. The concurrent validity of ODI is evaluated by correlating the ODI with other measures such as visual analogue pain intensity scale (r = 0.67), Roland-Morris Disability Questionnaire score (r = 0.71 [13], r = 0.76) [12], and short-form-36 (r = 0.25 to 0.46) [6].
The unidimensionality of ODI is also supported by factor analysis [9,10,12]. Meanwhile, responsiveness studies reported several cutoff thresholds to classify patient’s improvement: minimum clinically important difference (score range for m-ODI 0-50 points) = 7.5 points [5], 6 points [4], Guyatt’s responsive index = 3.49 points [4], minimal detectable change = 4.23 points [5], and standardized response mean = 1.25 [5].
On the other hand, there are limited studies on the psychometric properties of the ODI questionnaire using Rasch analysis at the item level [8,17-21]. Despite studies supporting unidimensionality of the ODI, the match of item difficulty to patient functioning, and general fit to the Rasch model, they revealed some disordered thresholds [17] and underused response category (especially category 2 from the 0-5 rating scale structure) [8,19,21] Inconsistent results from the Rasch analysis are also observed. For example, several studies [8,17-20,22] suggest lifting is the most challenging item; however, one study categorizes lifting items as having average difficulty [21]. The person separation index - an estimate of how well the scale can differentiate persons into statistically distinct person strata - demonstrates a wide range from 0.88 [17], 1.77 [8] to 2.83 [19]. Inconsistencies in the studies suggest that previous findings may be affected by specific settings (e.g., outpatient vs spine center, work-related vs spine deformity) and limited by their relatively small sample size (n = 42 [22], 95 [8], 100 [17], 133 [21], 408 [19], 942 [20], 1,610) [18]. Presently, there are only two studies [17, 22] examining the psychometric properties of m-ODI. To validate previous studies and achieve more reliable results, it is necessary to increase the sample size studied.
Furthermore, as norms (e.g., percentile rank distribution) and functional staging (function status classification) approach [23-26] has been applied to assist in clinically meaningful interpretations, such results have not yet been available for the m-ODI questionnaire.
Therefore, the purposes of this study were to: (1) examine the psychometric properties of 10-item m-ODI questionnaire using the Rasch analysis, (2) establish the percentile rank of a m-ODI score and (3) develop a functional staging to guide clinical interpretation of the patient’s improvement by interpreting m-ODI scores.
Methods
This study uses previously collected clinical patient data administered by clinical staff. Patients seeking rehabilitation
care entered their demographic data and completed computer-based, self-report surveys using
a Patient Inquiry® software developed by FOTO, Inc (Knoxville, TN, USA) prior to receiving their initial
evaluation and therapy. The same survey was administered again at discharge.
Data for this study were selected from the FOTO database if patients met the following criteria: (1) were 18 years old and older; (2) received outpatient physical therapy; (3) received orthopedic care due to lumbar spine impairments; and (4) completed the m-ODI questionnaire between January 2012 and May 2016. IRB approval was waived as this was a secondary data analysis using de-identified data free of personal identifiers.
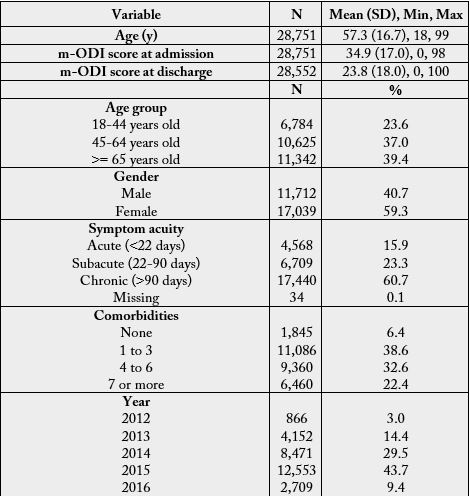
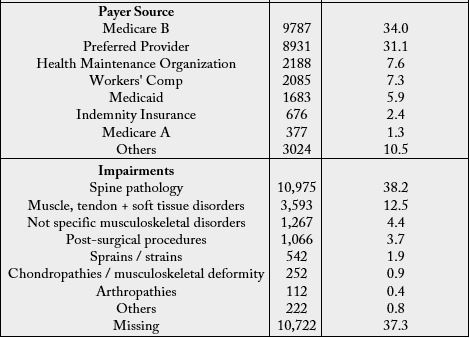
Data analysis was based on the survey of 28,751 patients with orthopedic lumbar spine impairments from
652 clinics in the US. Table 1 presents the demographic information of the patients.
The m-ODI questionnaire was designed to give clinicians information about how back or leg pain is
affecting a patient’s ability to manage in everyday life. The questionnaire includes 10 items: pain intensity
(item 1), personal care (item 2), lifting (item 3), walking (item 4), sitting (item 5), standing (item 6),
sleeping (item 7), social life (item 8), traveling (item 9), and employment/homemaking (item 10). Each
item consists of six statements correlating to scores of 0 through 5. Patients are instructed to choose the
statement that best matches his or her functional ability (i.e., the patient reported that he/she was able to
complete the task). Final scores are calculated as follows: [total score/(5 x number of questions answered)]
x 100% and range from 0 to 100. A score of 0 indicates the least disability, and a score close to 100 represents
the greatest disability (i.e., lower scores are better). Recommended by Fairbank et al., five levels of
the score were suggested: (1) 0% to 20%: minimal disability, (2) 21% to 40%: moderate disability, (3) 41%
to 60%: severe disability, (4) 61% to 80%: crippled, and (5) 81% to 100%: bed-bound [2,3]. This classification
has been applied in routine clinical practice and medical research [27-29]. For patients with minimal
disability (0%-20%), this group can cope with most living activities, apart from requiring advice on lifting,
sitting posture, physical fitness, and diet. For patients with moderate disability (21%-40%), travel and
social life are more difficult and they may be disabled from work. Personal care and sleeping are not grossly
affected and the patient can usually be managed by conservative means. For patients with severe disability
(41%-60%), pain remains the main problem in this group but activities of daily living are affected. For
patents in the crippled disability (61%-80%), back pain impinges on all aspects of the patient’s life. For
patients with the most disability (81%-100%), these patients are either bed-bound or exaggerating their
symptoms.
The m-ODI data collected at admission were analyzed using the Rasch partial credit model (PCM) to
account for the m-ODI’s polytomous rating scale structure in which each item has a unique rating scale
structure. The Rasch model assumes the probability of endorsing an item (i.e., be able to completing a
task) depends on the relationship between a person’s ability and an item’s difficulty. The item difficulty is
similar to the concept of the percentage of patients who can complete a particular task successfully (or respond
to an item correctly). The larger the percentage completing a task or getting an item right, the easier
the item. Rasch analyses were performed with the Winsteps software [version 3.90] [30].
We examined the rating scale structure using Linacre’s three essential rating scale criteria: [31] (1) at
least 10 observations should be in each rating scale category; (2) average measures (i.e., Rasch-Thurstone
thresholds) should advance monotonically (i.e., the step calibrations become successively more positive as
category number increases); and (3) outfit mean-squares should be less than 2.0. Because our sample size
was relatively large, we increased the first criterion to be at least 300 observations should be in each rating
scale category. Categories with low frequency counts or disordered rating scale structure may suggest that
the operational definition of the rating scale category can be assigned to the respondent only in rare situations,
with a narrowly defined scope, or was redundant when other response categories were present.
Based on how hard or easy patients perceived (i.e., have the functional ability or are able to complete the
task), the Rasch mathematical model computes each item’s difficulty estimate and each item’s rating scale
thresholds before establishing the empirical item difficulty hierarchy in logits (the logit of the probability
is the logarithm of the odds). The empirical item hierarchies are supposed to reflect the underlying theoretical
basis of the construct. To simplify data interpretation, item difficulty parameters and personal measures
were expressed as higher scores (in logits) representing more difficult items or persons with higher
(lumbar) functioning.
Fit statistics were performed to investigate whether the response patterns on the lumbar functioning fit
the Rasch’s probabilistic model. A fit statistic index calculates the ratio of the observed variance divided by
the expected variance. The index ranges from 0 to positive infinity with an ideal value of 1. Outfit is based
on a sum of squared standardized residuals, the differences between the observations and their expected
values according to the Rasch model. Infit is an information-weighted form of outfit and is more sensitive
to item fit around the person’s ability level. Items with fit statistics greater than 1.4 were considered misfit
items [32].
In Rasch analysis, both person ability and item difficulty estimates are expressed on a common metric
in logits. To determine whether the items are of appropriate difficulty for the sample, comparison of the
personal measure distribution to the item difficulty parameter distribution were performed using a visual
inspection of the two distributions. Ceiling and floor effects, which could reduce the chance to detect true
change, were also examined.
The person separation index (G) is an estimate of how well the scale can differentiate persons into statistically
distinct person strata [strata = (4*separation + 1)/3] [33]. Statistically distinct levels of item difficulty refers
to difficulty strata with centers three calibration errors apart [33]. For example, a strata equal to 3 indicates
that the scale can statistically distinguish patient lumbar functioning at least 3 (e.g., high, middle and low)
levels.
DIF occurs when groups have different probabilities of endorsing a given item on a polytomous rating
scale after statistically controlling for overall personal abilities, and could become a source of bias in person
measurement. In other words, DIF analysis can be used to examine whether the item difficulty hierarchy is
similar across different groups after controlling for the ability levels of the compared groups. In this study,
the DIF [34] was determined by calculating the mean difference in item difficulty of the item between the
two groups, and then dividing the result by the pooled standard deviation.
Suggested by Linacre, there should be at least 0.5 logits for DIF to be noticeable. We performed DIF analysis on m-ODI items by gender, age group (18-44, 45-64, >=65 years old), and acuity (acute: <22 days, subacute: 22-90 days, chronic: >90 days). The DIF analysis is a series of pairwise t-tests, which equals item difficulty estimates contrast divided by the joint standard error. Since large sample size may result in trivial differences showing significant effect, we a priori determined that DIF items were those with: (1) statistically significant t-test (p-value =<0.01), and (2) difference in item difficulty estimates of 0.35 (logits) or greater.
To assess unidimentionality, we conducted exploratory factor analyses (EFA) of latent trait variables, followed
by confirmatory factor analyses (CFA), utilizing Mplus (Muthe´n & Muthe´n, Los Angeles, CA)
[35]. We reported: (1) the factor loadings, and (2) variances explained by each factor. As suggested by
Nunnally [36], items with factor loadings above 0.40 in one factor are preferred. One-factor model fit was
evaluated using the comparative fit index (CFI), the Tucker-Lewis index (TLI), and the root-mean-square
error of approximation (RMSEA). The TLI and CFI range from 0 (poor fit) to 1 (good fit). Values of CFI
and TLI greater than 0.90, and RMSEA values less than 0.08 are indicative of good model fit [37].
Functional staging [38] refers to a set of hierarchical outcome levels that can be used to classify a patient
into different stage levels and describe an individual’s expected functional status within each level. The
functional staging was developed using the following steps: [23-26] (1) built a conceptual model based
on clinical judgment, (2) determined the cut-scores between stages identified in step 1, and (3) specified
expected performance at each level. As described [2,3], the m-ODI has an existing score interpretation
that aggregates the index into 5 hierarchical functional levels with 4 cut-scores along the functional status
continuum: (1) 0% to 20%: minimal disability, (2) 21% to 40%: moderate disability, (3) 41% to 60%: severe
disability, (4) 61% to 80%: crippled, and (5) 81% to 100%: bed-bound. As a result, we primarily specified
the expected performance by merging the probabilistic model in which each response category has a unique
threshold for each item, and we aligned these thresholds to develop the functional staging.
Results
All rating categories of the m-ODI items had at least 300 observations, except three response categories: ‘5’
in personal care item (n = 90), ‘5’ in sitting item (n = 121), and ‘5’ in walking item (n = 100). No items had
disordered rating scale thresholds, but 2 thresholds had outfit mean-squares greater than 2.0: (1) response
category ‘5’ “I do not get dressed, wash with difficulty, and stay in bed” in personal care item, and (2) response
category ‘5’ “pain prevents me from sleeping at all” in sleeping item. The category probability curves (Figure
1) show how probable the observation of each category (y-axis) is for measures relative to the item measure
(x-axis). Results revealed that few response categories were less likely to be observed.
For example, response category ‘2’ in pain intensity, traveling, lifting, standing; ‘1’ in sitting; ‘4’ in employment/ homemaking, and narrow scope in middle response categories in the sleeping item. These response categories were suggested as being underused or having narrowly defined scope [e.g., for the employment/ homemaking item, if patients’ lumbar spine condition was worse than response category ‘3’ (pain prevents me from doing anything but light duties), patients tended to report ‘5’ (pain prevents me from performing any job or homemaking chores) rather than response category ‘4’ (pain prevents me from doing even light duties)].
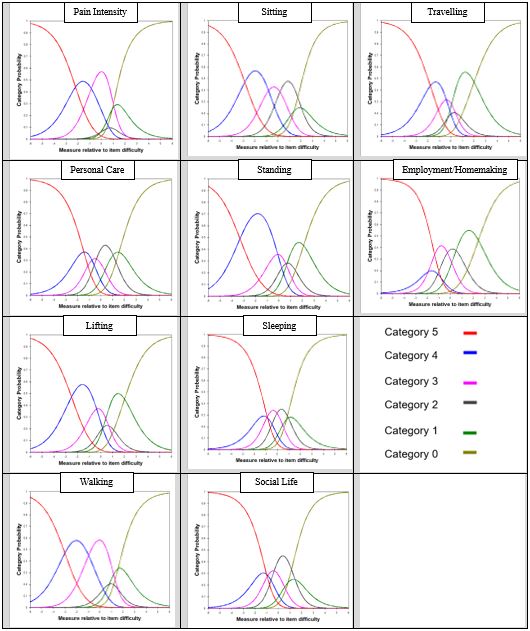
Table 2 presents the estimated item statistics of the m-ODI items in difficulty order. Item ‘lifting’ (on the
top) appeared to be the most difficult item, followed by ‘pain intensity’. Item ‘personal care” (at the bottom)
was the easiest.
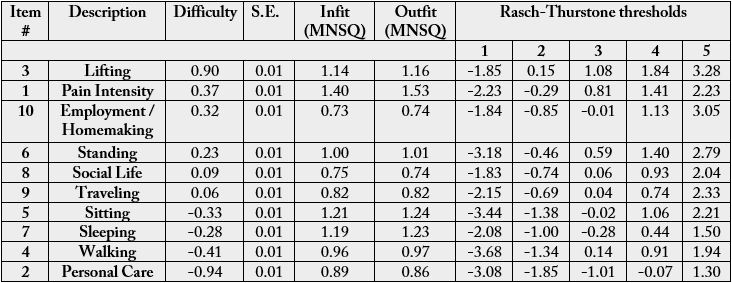
*Rasch-Thurstone thresholds (50% Cumulative Probability) is the thresholds where a person at the boundary between “1” and “2” would have a 50% chance of selecting a rating category of ‘1’ or below, and a 50% chance of selecting ‘2’ or above.
All items showed good infit and outfit statistics, except the pain intensity item which had a marginal misfit
(outfit MNSQ = 1.53 > 1.40).
Comparing to the mean (SD) of item difficulty estimates of 0.0 (0.49) logits, the patient ability level, on
average, had a slightly higher mean (SD) of 0.9 (1.0) logits, suggesting that items were slightly easier for
the patient sample. However, only 179 (0.6%) patients who obtained the maximum score (i.e., ceiling) and
0 (0%) patients who had the minimum score (i.e., floor), suggesting sufficient evidence for the lack of floor
or ceiling effects.
With a separation index equaled to 2.1, the m-ODI items can differentiate patients into 3.1 statistically
distinct person strata.
DIF analysis supported that m-ODI items were free of DIF by gender and symptom acuity, but 3 items
were suggestive of DIF by age group. Sitting was easier for patients >= 65 years old as compared to patients
18-44 years old (difference between item difficulty estimates was 0.71 logits). Standing, and walking
was more challenging for patients >= 65 years old as compared to patients 18-44 years old (differences
were 0.54 and 0.83 logits).
Results supported the unidimensionality of the m-ODI questionnaire. The factor loadings ranged from
0.80 (employment/homemaking) to 0.45 (pain intensity). The CFI was 0.88, the TLI was 0.95, and the
RMSEA was 0.13, suggesting marginally good model fit. The first factor explained 48.6% of the total variance,
followed by 10.7% variance explained by the second factor, and 8.3% by the third factor.
To assist in clinical interpretation, Table 3 presents the percentile rank distribution of the raw score and
Figure 2 shows the (raw) score distributions of the m-ODI questionnaire at admission and at discharge.
On average, the mean (SD) m-ODI at admission was 34.9 (17.0) and improved to 23.8 (18.0) at discharge.
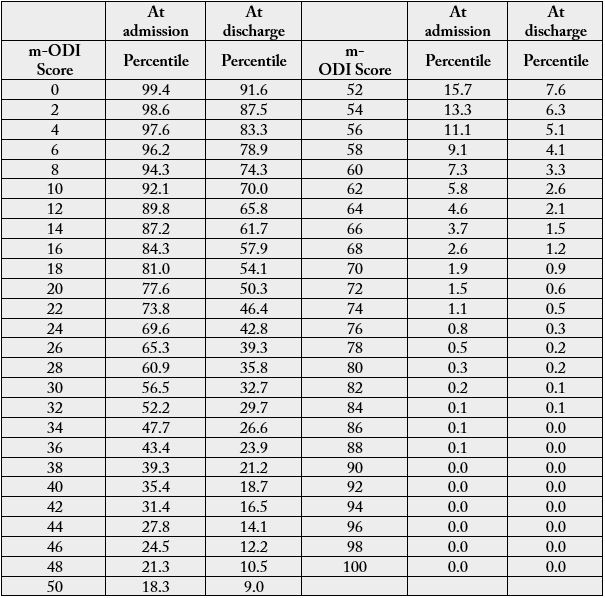
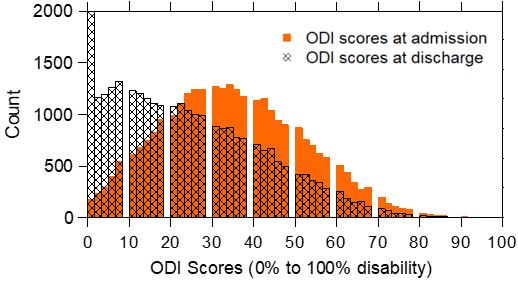
Figure 3 displays the functional staging of the m-ODI questionnaire and shows the expected response
(horizontal bars) to a given item as a function of the underlying ability (i.e., functional disability) estimated
by the m-ODI questionnaire. In this figure, the m-ODI items are listed in descending order of difficulty
in the left column - more challenging items are listed on the top and the easier items are listed at the
bottom. Beneath the figure is the m-ODI score continuum ranging from 0 to 100 (higher values represent
greater disability) separated by different levels of functional staging ranged from level 1 (bed-bound) to
level 5 (right or minimal disability). The cut-scores distinguishing between neighbored levels were 20%,
40%, 60%, and 80%.
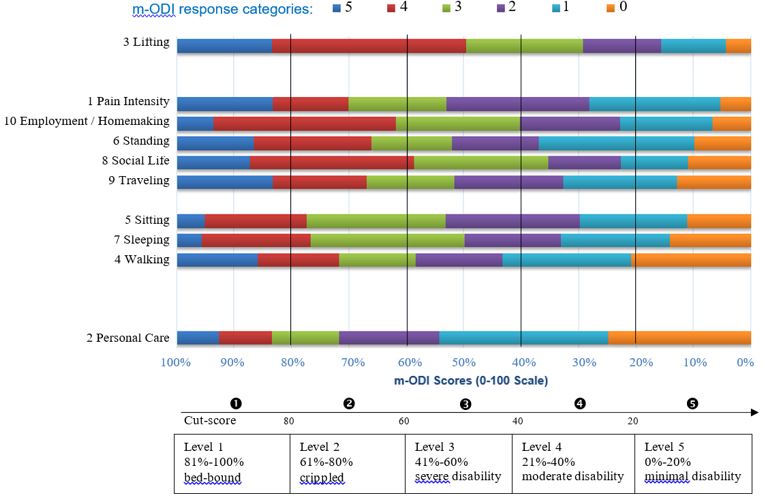
Using the functional staging method, we can compare the patient’s m-ODI score to the functional stages and better interpret the patient’s score. The expected responses of each item at each functional level can be obtained by drawing a vertical line over an m-ODI score (x-axis) on the figure.
One patient record and her responses on m-ODI items was selected (not randomly) from the data set. The
patient, Mrs. Jane Doe (female, age 44), came to the clinic due to subacute lumbar spine pathology. Her
initial m-ODI score was 56 at admission, and was 18 at discharge. To visualize her responses, we plotted
all her responses using the keyform in Figure 4. Note that the keyform is Rasch model based and the
x-axis is the person measures estimated by the Rasch model in logits, not the m-ODI (raw) scores. In the
functional staging (Figure 3), all the scoring are based on m-ODI scores.
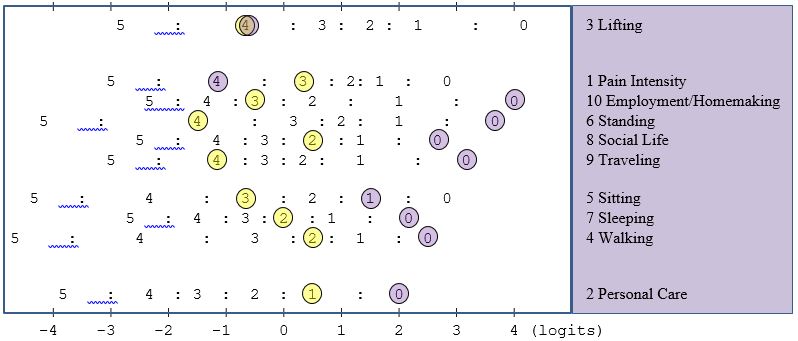
At admission, the functional staging classified Mrs. Jane Doe as having ‘severe disability’ (level 3). By drawing a vertical line at 56 (on the x-axis), she was expected to report a ‘4’ (I can lift only very light weights) on lifting, ‘3’ on most items, ‘2’ on walking (pain prevents me from walking more than ½ mile) and ‘1’ on personal care item (I can take care of myself normally, but it increases my pain). The real responses of items 1 to 10 from Mrs. Jane Doe and the expected responses ‘()’ based on the staging were 3(3), 1(1), 4(4), 2(2), 3(3), 4(3), 2(3), 2(3), 4(3), and 3(3), respectively. Infit and outfit statistics for Mrs. Jane Doe were 0.41 and 0.39 (both <1.40). The real responses were very close to the expected responses.
At discharge, the functional staging classification suggested Mrs. Jane Doe improved to level 5 (minimal disability). The real responses of items 1 to 10 and the expected responses ‘()’ were 4(1), 0(0), 4(2), 0(0), 1(1), 0(1), 0(1), 0(1), 0(1), and 0(1), respectively. Infit and outfit statistics for Mrs. Jane Doe were 2.35 and 1.66 (both >1.40), indicating a mis-fit response pattern (e.g., item 1 pain intensity with observed ‘4’ vs expected ‘1’). Specifically, Mrs. Jane Doe had no difficulty in almost all daily activities, except that the pain medication provides her with little relief from pain, and the pain prevented her from lifting medium to heavy weights.
Discussion
As compared to prior studies [8,17-21], this paper examined the psychometric properties of the m-ODI
questionnaire with a substantially larger sample size and specific for patients seeking outpatient physical
therapy services. Overall, results showed that the m-ODI questionnaire has sufficient psychometric properties.
The coverage of m-ODI items matched well with the patient functional abilities, and m-ODI items
can differentiate persons into at least the statistically distinct person strata of: high, middle, and low.
Despite these different samples, several findings were similar. Results supported the unidimensional onefactor structure. Item ‘lifting’ appeared to be the most difficult item, and ‘sleeping’, ‘walking’ and ‘personal care” tended to be the easy items. Similar to two other studies [17,22] employment/homemaking turned out to be on the 3rd (our study) or 4th (Choi’s study [22], Davidson’s study [17]) difficult item. Interestingly, Davidson et al. [17] also showed walking item consistently exhibited uniform DIF by age (18-44, 45-64, 65+) across the original and modified ODI questionnaires.
Prior studies show great variations of item difficulty hierarchical order [8, 17-21] and similarly, our study suggests a different hierarchical order of items at the middle difficult level. In our study, we report person separation index of 2.10, which is higher than 0.88 (100 patients seeking physical therapy treatment) [17] and 1.77 (95 community-dwelling adults) [8], but lower than 2.83 (408 patients in an academic spine center) [19]. We did not observe the ceiling and floor effects as described by Brodke et al. [18] who reported ceiling effect of 3.9% and floor effect of 29.9%.
It has been reported that low back pain demonstrates a bimodal distribution with peaks between 25 and 29 years of age and after 65 years of age without differentiation by underlying etiology [1,39]. Some studies have shown no gender difference [1], while others have shown women to have significantly increased incidence rate for low back pain or degenerative spondylolisthesis compared with men [40,41]. In our sample, we found that the m-ODI had a unimodal distribution with one clear peak around 65 to 75 years of age, and women had a higher incidence rate with a ratio of approximate 1.46 (i.e., 17,039 vs 11,712) visiting outpatient physical therapy due to orthopedic lumbar spine impairments.
In confirmatory factor analysis of ODI items, Gabel et al. [9] verified a one-factor solution accounting for 54% of the total variance structure. In our study, the factor analysis showed similar results with the first factor explaining 49% of the total variance. During the exploratory factor analysis of two-factor solution, we found the CFI and TLI improved to 0.96 and 0.98, respectively, suggesting a better model fit. Seven out of 10 m-ODI items had factor loadings above 0.40 on the first factor. The remaining 3 items: standing and walking items had high factor loadings (0.67 and 0.86, respectively) on the second factor and lifting item had almost even loadings (0.32 on the first factor and 0.37 on the second factor). Such a finding suggested some practical concerns of pulling items with different aspects together to capture the functional disability. Nonetheless, the m-ODI items have been shown to be clinically useful.
After inspecting rating scale structure, some studies [8,20,21] decided to collapse categories (e.g., merge response categories 1 and 2, as well as 4 and 5). We decided not to collapse categories for couple of reasons. First, unlike other measures with Likert scale rating scale structure, each of m-ODI item has its own operational definition. Therefore, response categories need to be inspected by each item and merging the same response categories across all 10 items may obscure useful information. Second, Page et al. [8] found that the person separation and reliability did not improve after collapsing response categories. Third, it did not provide practical benefits as clinicians or researchers still use the original version of the questionnaire, rather than the revised questionnaire. Last, if indeed the response categories were revised, validation and duplication studies would be needed to support the practical use of the questionnaire.
There are several clinical application of the functional staging. For example, clinicians can set short-term or long-term goals by inspecting expected responses between (1) m-ODI score at admission and (2) m-ODI score at admission plus minimal detectable change points. Meanwhile, patients’ unexpected responses (e.g., observed response is deviated from the expected response) are easy to identify and these may be useful to help clinicians manage patients who may consider whether there is a logical reason why the client had an unexpected response.
There are several limitations of this study. Since this study was a secondary analysis of prospectively collected data via a proprietary database management company, the researchers were not in control of the data collection procedure. Missing values (e.g., symptom acuity and impairment codes) were inevitable as data were collected in routine outpatient clinics, and the database does not link to the electronic medical records. Specific impairment codes were missing for 37% patients. There were 199 (0.7%) patients with missing m-ODI scores at discharge. Selection biases associated with patients choosing a participating clinic are unknown and might affect the generalizability of results. Clinics, which subscribe services from FOTO, Inc., might be different from other clinics that did not participate. We reported the clinical interpretation of the m-ODI based on a sample of patients with varies etiologies. Similar procedures should be validated across different specific diagnostic groups within patients seeking outpatient rehabilitation therapy.
Conclusion
This study provided psychometric analysis of the m-ODI questionnaire and supported its use in outpatient
rehabilitation settings. By deriving more clinically meaningful interpretations of outcomes measures, we
hope that it may facilitate use of these measures by clinicians in their routine clinical practice.
Conflict of Interest Statement
The authors declare no conflict of interest.
Bibliography


Hi!
We're here to answer your questions!
Send us a message via Whatsapp, and we'll reply the moment we're available!