Biography
Interests
Adeyeye Emmanuel Ilesanmi1*, Adubiaro Habibat Omolara2 & Idowu Olajumoke Tolulope3
1Department of Chemistry [Analytical Unit], Ekiti State University, Ado-Ekiti, Nigeria
2Industrial Chemistry Department, Federal University, Oye Ekiti, Ekiti State, Nigeria
3Department of Chemistry, Afe Babalola University, Ado Ekiti, Ekiti State, Nigeria
*Correspondence to: Dr. Adeyeye Emmanuel Ilesanmi, Department of Chemistry [Analytical Unit], Ekiti State University, Ado-Ekiti, Nigeria.
Copyright © 2019 Dr. Adeyeye Emmanuel Ilesanmi, et al. This is an open access article distributed under the Creative Commons Attribution License, which permits unrestricted use, distribution, and reproduction in any medium, provided the original work is properly cited.
Abstract
The levels of fatty acids, phospholipids and sterols were evaluated in the innards of the male and female Neopetrolisthes maculatus using standard methods. All determinations were on dry weight basis. Results showed the crude fat to vary as follows: 11.8g/100g (female) -12.5g/100g (male) and the corresponding total fatty acid ranged from 11.0 - 11.7g/100g. Whilst the total metabolisable energy ranged from 437kJ/100g (female) - 463kJ (male) (or 106-113kcal/100g) in a crude fat, the range was 407 - 433kJ/100g (or 99.0 - 105kcal/100g) in the fatty acids. SFA varied from 20.2 - 24.4% of total fatty acids; total unsaturated fatty acids varied from 75.6 (male) - 79.8 (female)%; MUFA range was 31.3 (male) - 34.5 (female)%; PUFA range was 44.4 (male) - 45.3 (female)% whereas the PUFA/SFA range was 1.82 - 2.24. Some calculated quality parameters had these values: AA/DGLA (91236 - 114623), EPSI (1.42 - 1.31), EPA/DHA (1.46 - 2.76), LA/ALA (5.08 - 5.26), MUFA/SFA (1.28 - 1.71) and n-6/n-3 (0.2251 - 0.2992). The food equivalents of the fatty acids followed the trend of the various fatty acids in the samples. The phospholipids levels were higher in the females than the males on pairwise comparison, lecithin was the highest concentrated phospholipid in both samples with values range of 224mg/100g (male, 61.3%) - 276mg/100g (female, 61.1%) and total ratio of male: female values of 1.00: 1.23. In the sterols, total values were generally low at 76.1mg/100g (male) - 101mg/100g (female) and ratio of 1.00:1.33. Sterols of significance were cholesterol 66.2mg/100g (male, 87.0%) - 88.6mg/100g (female, 87.8%) and campesterol of 9.90mg/100g (male, 13.0%) - 12.4mg/100g (female, 12.2%). Statistical analyses of the fatty acids, phospholipids and sterols showed significant difference in each case at r=0.01 with corresponding high levels of index of forecasting efficiency between the sexes showing that the innards of one could instead be used biochemically in place of the other one.
Abbreviations
SFA : Saturated Fatty Acid
MUFA : Monounsaturated Fatty Acid
PUFA : Polyunsaturated Fatty Acid
v/v : Volume Per Volume
h : Hour
XFA : Fatty Acid Conversion Factor
TL : Total Lipids
FACID : Fatty Acid
Ep : Edible Portion
FAO : Food and Agricultural Organization
rxy : Correlation Coefficient
rxy2 : Variance
Rxy : Regression Coefficient
CA : Coefficient of Alienation
IFE : Index of Forecasting Efficiency
TC : Total Cholesterol
LDL : Low Density Lipoprotein
CV% : Coefficient of Variation
SD : Standard Deviation
LA : Linoleic Acid
AA : Arachidonic Acid
ALA : Alpha-Linolenic Acid
EPA : Eicosapentaenoic Acid
DHA : Docosahexaenoic Acid
WHO : World Health Organization
DHLA : di-homo-γ-linolenic acid
EPSI : Essential PUFA Status Index
DRI : Dietary Reference Intake
Introduction
Crab has been adjudged to be highly nutritious and healthy owing to its protein content, unsaturated
fatty acids, carbohydrate and mineral composition. Crab is consumed by many individuals as it is often
recommended for pregnant women. Many indigenous groups understood the necessity for special foods
prior to conception, during pregnancy and during lactation; crab was one of these foods [1].
Crab insides (innards) have been used in a variety of ways. There is a Japanese cuisine involving principally the organs of crab blended with mixture of viscera; Fiji natives use a particular specie of spider crab fed to mothers during and prior to pregnancy to produce children “physically excellent and bright mentally”. There is then a message from many wise traditions around the planet: eat crab during the period of preconception, pregnancy and lactation- and eat the whole crab [2]. The meat, hepatopancreas and gonads are all edible parts of the Chinese mitten crab, Eriocheir sinensis [3]. While consumers in western societies often choose to eat the meat alone, Asiatic consumers greatly prefer consuming the hepatopacreas and gonads. This in fact contributes to the popularity of mitten crabs as a delicacy in China with the hepatopancreas of males been especially prized, followed by the gonads of both male and female crabs [4].
Neopetrolisthes maculatus is a spotted crab. There are two different colour forms, although the ground colour of the bodies of both forms is white. The two different colour forms are easily differentiated by the different colours on the carapace and the chelipeds [5].
The first major information on the nutritional composition of the innards of N. maculatus can be found in Adeyeye and Jegede [1]. Here, the followings were reported in the male and female innards of N. maculatus: proximate, minerals, vitamins, mineral ratio and mineral safety index. The work reported in this article is based on the assessment of lipid composition (total crude fat, total fatty acids, fatty acid profiles, sterols and phospholipids) in conjunction with their quality evaluation. The colour pattern of the present samples resembles the Pacific Ocean N. maculatus population [6]. Both male and female samples of N. maculatus innards were used in these experiments.
Nutraceuticals refer to foods having a medicinal effect on health of human beings. Major nutraceuticals possess multiple therapeutic effect with lacking unwanted effects hence attract more consumer interest. Nutraceutical categories are in the group of dietary fibres, probiotics, polyunsaturated fatty acids, antioxidant, vitamins, polyphenols and spices. This work focuses mostly on the polyunsaturated fatty acids and their health implications when consumed by human beings.
Materials and Methods
Wet samples were collected from trawler catches from the Atlantic Ocean at Orimedu beach in Ijebu -Lekki
area of Lagos, Lagos State, Nigeria. The experiment took place between November 2014 and June 2015.
The crabs were washed with distilled water to remove adhering contaminant and transported in ice crushed
containers to the laboratory for identification and preservation prior to analyses. The crabs were identified
in the Department of Forestry, Wildlife and Fisheries Management of Ekiti State University, Ado-Ekiti, wrapped in aluminium foil and stored in a cool chamber of < 4ºC for 2 - 3 days prior to analyses.
More than ten matured crabs were caught with the net although three samples were used for this study.
The three whole crabs were separated fresh, two were males and one was female. Although, about 10 crab
samples were available but only three of them were used. When the samples were examined in the laboratory
only three of them (2 males + 1 female) were observed to be fully matured. Sex and maturity were important
in the analysis. Hence, only three were used.
Typically a crab is killed by boiling it alive; however, in an attempt to give the crab a rapid death, it was preserved under cold temperature. To remove the viscera the crab was stabbed through its lower belly just above the end of the small tail flap. The viscera was then dried in the oven at 105ºC and blended after cooling to the laboratory temperature.
The crude fat was extracted with chloroform/methanol (2:1 v/v) mixture using the Soxhlet extraction
apparatus [7]. Whilst about 0.25 g of each aliquot was weighed into the extraction thimble for fat extraction,
the extraction lasted 5 - 6 h. The crude fat extracted was converted to methyl ester using the boron trifluoride
method [7]. The sterol analysis was as described by AOAC [7]. Modified method of Raheja et al. [8] was
employed in the analyses of the extracted oil for phospholipids content determination.
In a situation where the content of total fatty acids in food or fat is not given, it is necessary to calculate it
by using fatty acid conversion factor (XFA). The conversion factor reflects the ratio between the sum of fatty
acids and total lipids (TL) in the food [9]; see below:

As fatty acid conversion factors (XFA) are given only for lean (0.7) and fatty fish (0.9) (without indication of corresponding fat content) and not for crustaceans and molluscs, FAO/INFOODS [10] made further investigations on these factors.
Two ways to estimate fatty acid conversion factors are proposed.
1. If fat is ≥ 0.55g/100g EP, the formulas of Weihrauch et al. [9] should be used:

Total lipids (TL) should be expressed as g/100g EP.
2. If fat is < 0.55g/100g EP, the following fatty acid conversion factors should be applied to avoid negative values for the conversion factors [10]:

Since the crude fat values were greater than 0.55g/100g EP, the formula:

was used to calculate the conversion factor.
Further calculations were the conversion of the edible portion (EP) into two different unit of energy: kJ/100g
EP and kcal/100g EP.
Statistical analysis [11] was carried out to determine mean, standard deviation, coefficient of variation in
percent. Also calculated were linear correlation coefficient (rxy), coefficient of determination (rxy2), linear
regression coefficient (Rxy), coefficient of alienation (CA) and index of forecasting efficiency (IFE). The rxy
was subjected to the Table (critical) value at r = 0.01 to see if significant differences existed in the values of fatty
acids, sterols and phospholipids in the N. maculatus heterosexual innards.
Results and Discussion
Table 1 depicts the crude fat and the calculated total fatty acid levels of the samples on dry weight basis.
Also calculated were the other components (as single entities) and the corresponding metabolizable energy
(in kJ/100g and kcal/100g) for the crude fat, total fatty acids and other combined lipids. The value ratios of
crude fats and total fatty acid in female to male in each case was 1.00:1.06 respectively. In the male sample,
the fatty acid (FA) occupied a percentage of 93.6 whereas other lipids in male sample occupied a percentage
of 6.40; whereas FA in female sample was 93.22% and the other lipids had just 6.78%; this meant that
both male and female innards lipids had high level of FA leading to the possibility of low level sterols and
phospholipids. The difference in the crude fat values of the male and female innards of N. maculatus was low
at 0.70g/100g (5.60%) and this was followed in the FA at a difference of 0.70g/100g (5.98%) showing that
both values were close.
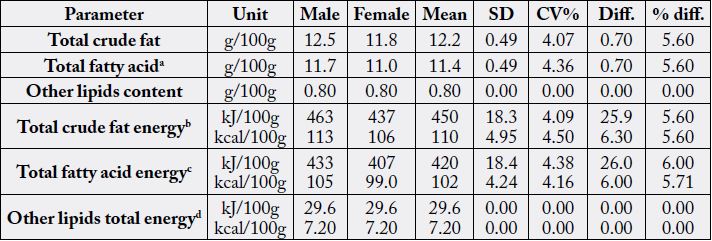
aCrude fat x XFA = 12.5 x 0.9370 (male) and 11.8 x 0.9359 (female); bTotal crude fat energy = crude fat x 37.0 or crude fat x 9.00; cTotal fatty acid energy = total fatty acid x 37.0 or total fatty acid x 9.00; Other lipids energy = other lipids value x 37.0 or other lipids value x 9.00; SD = standard deviation; CV%= coefficient of variation; Diff. = difference
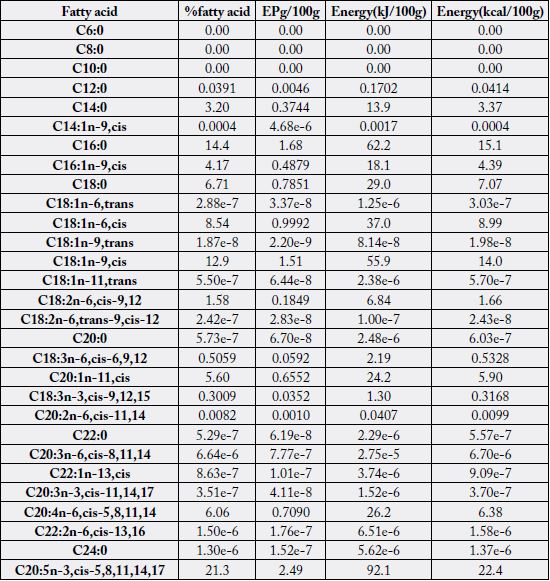
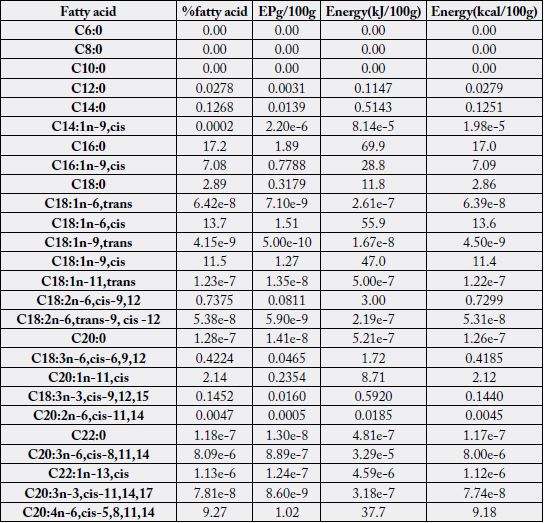
Table 2 contains the concentration of all the fatty acid profiles detected in the samples. These profiles
contained saturated, monounsaturated (cis and trans isomers), n -6 and n -3 fatty acids. Three fatty acids
(FAs) had 0.00% of total FA in both samples: C6:0, C8:0 and C10:0. Some FAs were < 0.1% and hence
could be regarded to be in traces, they were: C14:1n-9, cis; C18:1n-6, trans; C18:1n-9, trans; C18:1n-11,
trans; C18:2n-6, trans-9, cis-12; C20:0; C20:2n- 6, cis-11, 14; C22:0; C20:3n-6, cis-8,11,14; C22:1n-13,
cis; C20:3n-3, cis-11, 14, 17; C22:2n-6, cis-13, 16; C24:0 and C24:1n-15, cis showing trace FA values to
cut across saturated, monounsaturated, n-6 and n-3 FAs. In the variation in the FAs distribution in the
samples, majorly trace values were mostly having high values of CV% mostly ranging from 54.5 - 89.9;
however exceptions to this observations were in C14:0 (CV% = 131), C18:2n-6, cis-9, 12 (CV% = 51.6)
and C20:1n-11, cis (CV% = 63.2). Most high percentage differences between the sample parameters were
found in the trace values, but again with the exceptions of C14:0 (+96.0%), C18:2n-6, cis-9, 12 (+53.4%)
and C20:1n-11, cis (+61.8%). Fatty acids of significance in the two samples were (in % of total fatty acids):
C14:0 (0.1268 - 3.20), C16:0 (14.4 - 17.2), C16:1n-9, cis (4.17 - 7.08), C18:0 (2.89 - 6.71), C18:1n-6, cis
(8.54 - 13.7), C18:1n-9, cis (11.5 - 12.9), C20:1n-11, cis (2.14 - 5.60), C20:4n-6, cis-5, 8, 11, 14 (6.06 -
9.27), C20:5n-3, cis-5, 8, 11, 14, 17 (21.3 - 25.5) and C22:6n-3, cis-4, 7, 10, 13, 16, 19 (9.23 - 14.6). The two
most concentrated SFA were C16:0 (14.4% - 17.2%) and C18:0 (2.89% - 6.71%), two FAs competed for
first concentrated range in MUFA and they were C18:1n-6, cis (8.54% - 13.7%) and C18:1n-9, cis (11.5%-
12.9%); the two highest concentrated n-6 FAs were C18:2n-6, cis-9,12 (0.7375% - 1.58%) and C20:4n-6,
cis-5, 8, 11, 14 (6.06% - 9.27%); and in n-3 FAs we have C20:5n-3, cis-5, 8, 11, 14, 17 (21.3% - 25.5%) and
C22:6n-3, cis-4, 7, 10, 13, 16, 19 (9.23% - 14.6%).
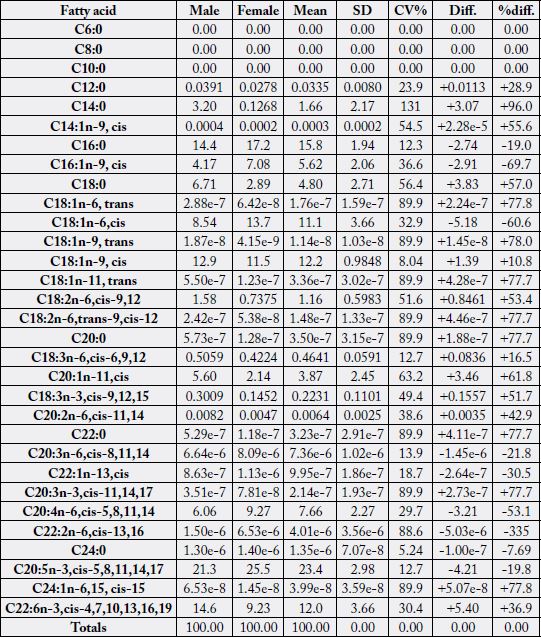
+ = male innards value > female innards value;
- = male innards value < female innards value
All determinations were on dry weight basis
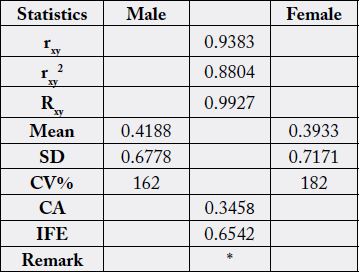
Table 3 contains the statistical analysis result from Table 2 data. The correlation coefficient (rxy) was positively
high (0.9388) and significantly different in the two samples. The regression coefficient (Rxy) showed
that for every one unit increase in the male FA, there was a corresponding increase of 1.06 in the female FA.
Both the general mean was similar at 3.57% (at a level of three significant figures) but slight differences in
the SD (5.78 - 6.51) and also in the coefficient of variation (CV%) at values of 162 - 182; this CV% and
SD values showed that FA concentrations were more varied in the female than the male. The coefficient of
alienation (CA) was low at 0.3444 with a corresponding high value for index of forecasting efficiency (IFE)
with a value of 0.6555. The values of CA and IFE are always in reverse relationship, either CA > IFE or IFE
> CA as the case maybe. The value is an indication of lack of relationship between two entities where the CA
value determines this characteristic. On the other hand, the higher the value of IFE the higher the correctness
of the prediction of relationship between two entities. Whilst CA is due to non-relationship, the IFE is
a reduction in the error of prediction between two relationships. CA + IFE = 1.00 (or 100%). In these results,
IFE was 0.656 (65.6%) whereas CA was 0.344 (or 34.4%); meaning that error of prediction of relationship
was just 34.4%. Since IFE(65.6%) > CA(34.4%) then the prediction of relationship is easy. With the high value of
IFE, it means that the physiological/biochemical functions of male N. maculatus can be performed by the
female and vice versa.
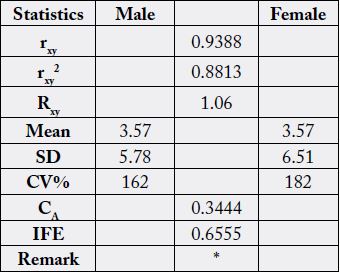
rxy=correlation coefficient; Rxy=regression coefficient; CA=coefficient of alienation; IFE=index of forecasting efficiency; *=results were significantly different at n-2 (df) (28-2 = 26) and r=0.01; [rT = 0.479 (critical value)]
Some quality parameters of the fatty acids of N. maculatus are shown in Table 4. They are extracts from Table
2. Parameters that are highly comparable in the crab samples were: SFA (20.2-24.4%) and CV% of 13.2; total cis – MUFA (31.3 - 34.5%) and CV% of 6.96; n-6 PUFA total (8.15 - 10.4%) and CV% of 17.3; n-3
PUFA total (34.9 - 36.2%) and CV% of 2.69; total MUFA (31.3 - 34.5%) and CV% of 6.96; total PUFA
(44.4 - 45.3%) with CV% of 1.47 and total unsaturated fatty acid, UFA (MUFA+PUFA) (75.6 - 79.8%)
with CV% of 3.79. This high level of UFA from N. maculatus makes the crab a very good source of essential
nutritionally valuable oils. A profitable extraction of nutritionally essential oils can also be possible from N. maculatus which can be used as supplements to enrich other food sources. Fatty acid with high differences
between the two samples were in: total trans-MUFA (1.91e-7 to 8.57e-7%) with CV% of 89.9 as well as
in CLA (18:2n, trans-9, cis-12) (5.38e-8 to 2.42e-7%) with CV% of 89.9. The values of Total UFA were
closely comparable to the values in A. montoviae and L. goreensis (71.7 - 73.2% and CV% of 1.53) [12].
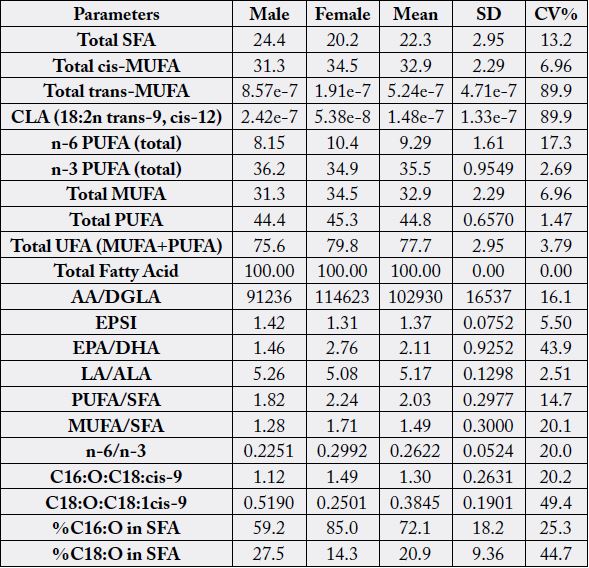
Table 5 contains the fatty acids distribution per 100g sample as food (denoted as EP g/100g where EP
means edible portion) in the male N. maculatus whereas Table 6 contains such values in the female sample. Depicted in the Tables 5 and 6 were the fatty acid values (%), the EP g/100g equivalent and the fatty
acid food levels in kJ/100g and kcal/100g energy levels. The EP g/100g, Energy (kJ/100g) and Energy
(kcal/100g) followed the trends in the corresponding % fatty acid values. The calculations accounted for all
the total FAs as calculated by crude fat x conversion factor for the samples (Table 1).
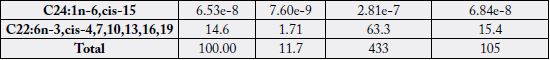
EPg/100g =% fatty acid/100 x total fatty acid;
Energy(kJ/100g) = EPg/100g x 37;
Energy (kcal/100g) = EPg/100g x 9
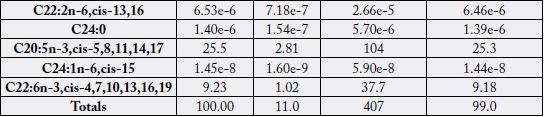
EPg/100g = %fatty acid/100 x total fatty acid;
Energy(kJ/100g) = EPg/100g x 37;
Energy(kcal/100g) = EPg/100g x 9
The statistical analysis of the data in Tables 5 and 6 is shown in Table 7. These values were high: rxy (positively
significant), rxy2, Rxy, CV% and IFE; whereas the followings were low: mean, standard deviation (SD) and
CA. The significant level was due to rxy > rT at r=0.01. Since IFE > CA, reduction in the error of prediction was
high and prediction of relationship was easy; hence physiological/biochemical functions could be vice versa.
* = results are significantly different at n-2 (df) (28 - 2 = 26) and r=0.01; [rT =0.479 (critical value)]
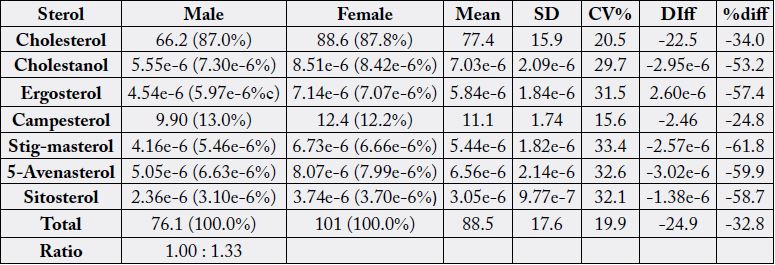
The sterol values of the male and female innards of N. maculatus have been depicted in Table 8. The total
sterol levels ranged from 76.1 - 101mg/100g with a ratio of 1.00 : 1.33, CV% of 19.9 and percentage
difference of - 32.8. Cholesterol occupied the highest position in both samples having range values of
66.2mg/100g (87.0%) - 88.6mg/100g (87.8%), CV% of 20.5 and percentage difference of -34%. The negative percentage differences were due to the fact that the male values were less than female values on parameter
comparisons. The only other significant sterol in the samples was campesterol having values of 9.90mg/100g
(13.0%) - 12.4mg/100g (12.2%) with CV% of 15.6 and percentage difference of -24.8. Other sterol components
were in trace levels of 3.10e-6% - 7.30e-6% in the males and 3.70e-6% - 8.42e-6% in the females
meaning that cholesterol and campesterol were the main sterols of the samples.
The statistical analysis of the variances from Table 8 is shown in Table 9. These values were high: rxy, rxy2,
Rxy, SD, CV% and IFE whereas low values were observed in the mean and CA. The rxy shows significance
difference among the heterosexual innard values. There was almost perfect prediction of relationship in the
sexually divergent N. maculatus innards sterols as IFE0.9914 >>> CA0.0086. This makes easy the substitution of
one sample for the other without negative consequences in their physiology/biochemical activities.
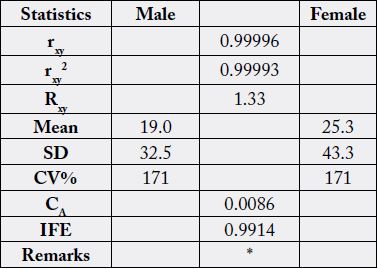
* = results significantly different at n-2 (df) (8 - 2 = 6) and r=0.01 [critical level =0.834]
In Table 10 we have the phospholipid profiles of the samples. Total phospholipids ranged from 366 -
452mg/100g with a CV% value of 14.8 and percentage difference of - 23.4. Like it was observed in the
sterols, all parameter levels in the male sample were correspondingly lower than in the female sample. In
both samples lecithin (phosphatidylcholine, PC) was the most concentrated and varied from 224mg/100g
(61.3%) - 276mg/100g (61.1%), CV% of 14.6 and difference of - 23.0%. The concentration ratio in the total
phospholipids was 1.00 - 1.23.
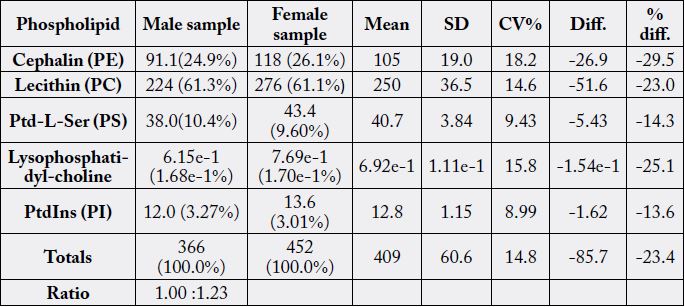
PE=phosphatidylethanolamine; lecithin = phosphatidylcholine; PS = phosphatidylserine; PI = phosphatidylinositol
The results in Table 10 were subjected to statistical analysis whose results are depicted in Table 11. These values were high: rxy, rxy2, Rxy, mean, SD, CV% and IFE leaving CA with a low value. Significant relationships
existed in the phospholipid profiles of the samples. Prediction of relationship in the samples was easy
because IFE0.9832 >>> CA0.0168.
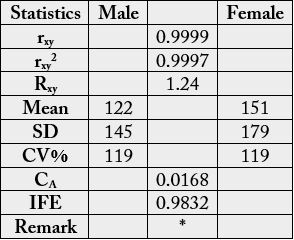
* = results significantly different at n-2 (df) (6 - 2 = 4) and r = 0.01 [critical level=0.917]
Discussion
The energy relationships in the two heterosexual innard samples were highly comparable and high in the
crude fat and FAs but low in the other remaining combined lipids. In the crude fat the metabolizable energy
range was kJ/100g (kcal/100g): 437 - 463 (106 - 113) in crude fat; 407 - 433 (99.0 - 105) in fatty acids and
29.6 - 29.6 (7.20 - 7.20) in other combined lipids. All the coefficient of variation percent (CV%) values were
low (< 5.00%) where applicable; such low CV% showed the close value relationships in crude fat (and other
parameters) in the heterosexual N. maculatus innards. These samples crude fat and FAs values were much
higher than the lagoon fishes of Acanthurus montoviae and Lutjanus goreensis having respective crude fat and
fatty acid values of g/100g: 5.15 - 6.25 and 3.61 - 4.38 [12]. The crude fat and fatty acids values were also
higher than 7.48g/100g crude fat in the skin of Pellenula afzeliusi with corresponding 5.23/100g FA [13];
and the value of 7.40g/100g (crude fat) and 5.18g/100g (FA) of barracuda fish [14].
Three SFAs are known as primary contributors to elevated blood cholesterol and hence contribute to cardiovascular disease, these three SFAs are C12:0, C14:0 and C16:0; C14:0 being the major culprit. SFA with 12, 14 or 16 carbons generally constitute about 25% - 50% of total fat in animal foods [12]. In the present samples all the C12:0, C14:0 and C16:0 constituted in both samples value of 17.4% - 17.6%. This is close to the value of 16.0% in A. monroviae but lower than the value of 25.7% in L. goreensis [12]. The likely negative effect on the heart could be due in part to an increase in blood clotting [15]. C18:0 is also thought to increase the risk of cardiovascular disease. However, C18:0 is not thought to be as hypercholesterolemic as the other SFAs probably because of its conversion to oleic acid [C18:1n-9, cis] [16]. Fatty acid metabolism pathways have been reviewed [17]. Fish are known to be able to synthesize, de novo from acetate, and the even-chain SFA. Radio tracer studies have shown that fish can convert 16:0 to the omega -7monoenoic and 18:0 to the omega - 9 monoenoic acid.
The C16:0 FA is very important in diet as it is present to some degree in virtually all fats and is usually by far the prevalent SFA in the diet. When C16:0 is considered on its influence on the lipoprotein profile, C16:0 could be intermediate, that is, it can be neutral when placed on triglyceride molecule with PUFA, MUFA or 18:0, or cholesterol-raising when attached along with 12:0+14.0. Also, in high amounts, 16:0 can even raise TC and LDL when substituted for 18:0, MUFA or PUFA in people with already elevated TC who eat large amount of cholesterol. Usually, the general advice has been to remove as much SFA from the diet as possible [18]. Enig and Fallon [19] had enumerated important roles of SFAs in the body chemistry.
They are : give body cells necessary stiffness and integrity as it forms its 50%; assist in the effective incorporation of calcium into the skeletal structure ( in the presence of about 50% SFA in the oil); lowering of Lp (a); protect liver from alcohol and other toxins, e.g. Tylenol; enhance immune system; assist in effective utilization of EFAs particularly retention of omega-3 FAs in body tissues; both saturated C18:0 and C16:0 are the preferred food for the heart, which is why the fat around the muscle is highly saturated giving the heart the ability to draw on this reserve in times of stress; short-and medium-chain SFAs have important antimicrobial properties thereby protecting us against harmful microorganisms in the digestive tract.
Accumulation of certain long-chain FAs is associated with degenerative diseases of central nervous system, they include behenic acid (C22:0; 1.18e-7% to 5.29e-7%) but about 1% in beef fat [20] and lignoceric acid (C24:0, 1.30e-6%-1.40e-6%) but about 1% in beef fat [20]. Accumulation occurs because enzymes needed to maintain turnover of those fatty acids are lacking [21]. Behenic acid has been detected to be a cholesterolraising SFA factor in humans [22]. Both lignoceric and behenic acids in the samples were of no significant values and therefore could not be of any nutritional health risk from N. maculatus.
Among the monounsaturated fatty acids (MUFAs) C18:1n-6, cis was the most concentrated MUFA in the male sample but C18:1n-9, cis was the most concentrated MUFA in the female with corresponding values of 12.9% and 13.7%. However, the percentage range of C18:1n-9, cis was 11.5% - 12.9% and for C18:1n-6, cis, the range was 8.54% - 13.7%. High variation occurred in the concentration of C18:1n-6, cis with CV% of 32.9 which was four times the CV% value in C18:1n-9, cis of 8.04. Whilst the percentage difference was -60.6% in C18:1n-6, cis, it was +10.8% in C18:1n-9, cis. The other important MUFA in samples were C20:1n-11, cis with values of 2.14%-5.60% and C16:1n-9, cis with values of 4.17%-7.08%; the percentage difference in C20:1n-11 was +61.8% and it was -69.7% in C16:1n-9, cis (Table 2). In A. monroviae and L. goreensis, the highest concentrated monoenoic fatty acid was C18:1n-9, cis with values range of 10.9-18.2% and CV% of 35.2 [12]; these values were close to the present levels of 11.5%-12.9%. All the C18:1n-6, trans; C18:1n-9, trans; C18:1n-11, trans and C18:2n-6, trans-9, cis-12 were all significantly low in both samples, they were all in traces (< 0.100% in each case). MUFA-trans monoenoic fatty acids are not useful nutritionally and the values in the samples cannot be deleterious in the samples consumption. Like SFA, MUFA-trans are relatively stable and take time to go rancid.
Oleic acid (C18:1n-9, cis) is commonly found as the main component of olive oil and in the oils from almonds, pecans, cashews, peanut and avocados; it is also the most abundant monoenoic fatty acid in human diet as well as in human and plant tissues being found in structural lipids and in deposit fats. About 78% of oleic acid is present in olive oil and it is believed to have especially valuable functional properties as part of the Mediterranean diet. Some important biological properties of oleic acid in both free and esterified forms are its being biosynthetic precursor of a family of fatty acids with the (n-9) terminal structure and with chain-lengths of 20-24 or more. Petroselinic acid (C18:1n-6, cis) which is another important monoenoic fatty acid in these samples had been shown through in-vitro studies [23] that triacylglycerols containing petroselinoyl [C18:1(n-12)] moieties are hydrolysed by pancreatic lipase at much lower rates than other triacylglycerols. Petroselinic acid (C18:1n-6, cis) is known to occour up to a level of 50% or greater in seed oils of Umbelliferae family that includes carrot, parsley and coriander. In the present report its range was 8.54%-13.7%. When the consumption of coriander (Coriandrum sativum) oil was compared with other oils, it was observed that coriander oil consumption led to significantly greater liver weights. On the other hand, no significant differences were observed among groups fed with various levels of oleic acid in body weight, the weights of heart, liver, kidneys, spleen or testes, lipid content of heart, or total cholesterol, HDL-cholesterol and triacylglycerol concentrations of blood plasma. Coriander oil ingestion led to the incorporation of C18:1(n-12) into heart, liver and blood lipids and to a significant reduction in the concentration of arachidonic acid in the lipids of hearts, liver and blood with a concomitant increase in the concentration of linoleic acid compared with other groups result. The data show that petroselinic acid from dietary triacylglycerols is absorbed by rat as readily as oleic acid, but the former reduces the concentration of arachidonic acid in tissue lipids which suggest [in view of earlier studies (Mohrhauer et al [24])] petroselinic acid-meditated inhibition of arachidonic acid synthesis.
Palmitoleic acid (C16:1n-9, cis) have values of 4.17% - 7.08% and CV% of 36.6 and percentage difference of -69.7 (Table 2). It has strong antimicrobial properties; it is found almost exclusively in animal fats. The FA is found in rich amounts in macadamia nut, olive, canola and peanut oils. C16:1n-9, cis is beneficial in reducing bad cholesterol (LDL) although it behaves like a SFA and not as an unsaturated FA in its effect on HDL cholesterol [25]. It also reduces fat deposition in blood vessels and reduces blood clot formation [26]. Gondoic acid [11-cis-eicosenoic acid (11-20:1 or 20 (n-9)] is a common (but may be minor) constituent of animal tissues and fish oils, often accompanied by the 13-isomer. The values of C20:1n-11, cis ranged from 2.14% - 5.60%. C20:1n-11 is found in rapeseed oil and seed oils of related species. One FA in the samples that is apparently responsible for favourable response of persons with nervous system disorders is erucic acid (C22:1 cis-13) [27]. Erucic acid was in traces in the samples having values of 8.63e-7% - 1.13e-6%. The administration of erucic acid in the diet will reduce the serum levels and brain accumulation of a very-longchain of SFAs (such as C26:0) responsible for demyelination [28, 29]. The production of longer-chain FAs of the n-9 family and n-7 family as well as the production of petrosenilic acid are shown in Scheme 1.
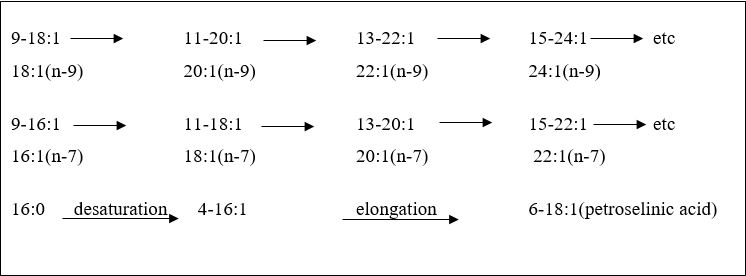
Table 2 still contains the concentration of PUFA n-6 and n-3 fatty acids. Among the n-6 and n-3 PUFAs, we have both long-chain (LC) and very-long-chain (VLC) FAs (LC, 18 and VLC, 20-24) carbon atoms. The major PUFAs found in samples were linoleic acid (LA) (C18:2, cis-9, 12), arachidonic acid (AA) (C20:4, cis-5, 8, 11, 14), alpha-linolenic acid (ALA) (C18:3 cis-9, 12, 15), eicosapentaenoic acid (EPA) (C20:5, 8, 11, 14, 17), and docosahexaenoic acid (DHA) (C22:6, cis-4, 7, 10, 13, 16, 19). The other n-6 FA of importance is C18:3n-6, cis-6, 9, 12; it has values range of 0.4224 - 0.5059% with CV% of 12.7 and percentage difference of +16.5. The values of C18:2n-6, cis-9, 12 were low at 0.7375 - 1.58%, high CV% value of 51.6 and high percentage difference of +53.4; AA values were relatively high at 6.06 - 9.27% of total fatty acids with relatively low CV% of 29.7 and high percentage difference of -53.1; EPA was the highest concentrated fatty acid in both samples and had range values of 23.4 - 25.5% of total fatty acids with both low CV% (12.7) and percentage difference (-19.8). DHA was also of high concentration with values of 9.23 - 14.6% having CV% or 30.4 and percentage difference of +36.9. The n-6 FA series are derivatives of LA whereas the n-3 series are derivatives of ALA. However, more physiologically important than these parent fatty acids are their elongated and desaturated derivatives of metabolites. Whilst the desaturated steps (especially the first step) tend to be slow, the elongation steps proceed rapidly. PUFAs affect the fluidity, flexibility and permeability of the membranes, they are the precursor of the eicosanoids, are necessary for maintaining the impermeability barrier of the skin and are involved in cholesterol transport and metabolism. Knowledge of the significance of the very-long-chain PUFA of the n-3 type, particularly EPA and DHA, for human health has increased considerably since the 1970s [30,31].
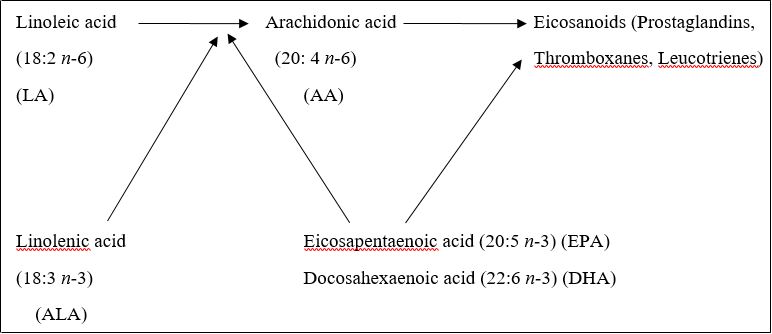
There are many health disorders that have been linked with an undesired overproduction of eicosanoids [32]. Eicosanoids are hormone-like compounds which include prostaglandins, thromboxanes and leukotrienes. Many eicosanoids originate from AA which can be synthesized from LA. Because of their competitive inhibition in the enzyme systems, FAs of n-3 type particularly EPA and DHA, can slow down the eicosanoid overproduction and thus prevent or cure health disorders (Fig. 1). This is further explained as shown in Fig. 2 from FAO/WHO [33]. Because of the high concentrated n-3 PUFA levels, the fatty acids in the samples will have high antiatherosclerotic efficiency [34].
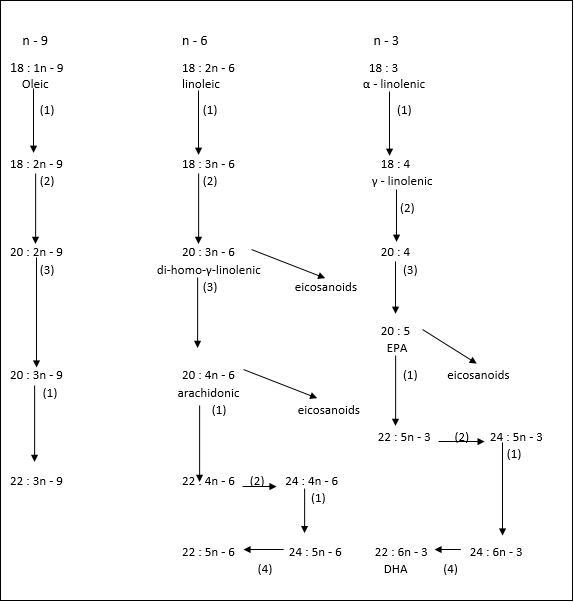
(1) = Δ 6 desaturases; (2) = elongases; (3) = Δ 5 desaturases; (4) = β - oxidation (peroxisomes) [33]
Cardiovascular diseases are known to pose a serious health risk and often rank first among cause of death in many developed countries. For example, for many years in Germany more than 500 per 100,000 inhabitants (1989: 586) have been dying annually of heart and circulatory disorders. On the other hand, carcinoma ranks “only” second with about 200 deaths per 100,000 [35] when compared with heart and circulatory disorders. Death rates from ischemic heart disease (in percentage of deaths) in the USA, Denmark and Greenland are 40.4, 34.7 and 5.30 respectively [36]. The low rate of deaths from cardiovascular disease in Greenland has been linked with the consumption of marine oils. Existing evidence suggests that long-chain n-3 PUFAs also have beneficial effects on diseases other than those of the heart and of the blood vessels. They are [37]: inflammatory diseases; nephritis; strokes; arthritis; lupus erythematosis; multiple sclerosis; cancer; skin diseases; asthma. Generally observed is that marine species are characterized by low levels of linoleic acid (C18:2n-6, cis) and alpha linolenic acid (C18:3n-3) as well as high levels of very-long-chain n-3 PUFAs; see Table 2 [where LA = 0.7375% - 1.58%; ALA = 0.3009% - 0.1452% (which were all low); EPA = 21.3% - 25.5%; DHA = 9.23% - 14.6%]. Steffens [37] affirmed that this trend was also observed in various fatty acid composition (%) of several marine fish lipids. EPA (20:5n-3) and DHA (22:6n-3) are the predominant FAs [38]; this observation is very true of the present samples. The fatty acid composition of the marine phytoplankton is a reflection of the typical fatty acid composition of the marine fish oils. These fatty acids reach the fish via the food web [39]. Huge variation exists in FA composition of different individual fish of the same species, mainly due to differences relative to food (and probably sex) as was shown for menhaden, herring, mullet oil [40] and the present samples under discussion. Marine fish depends on a dietary supply of polyunsaturated n-3 acids for rapid growth, since in many cases they have only a very limited desaturase activity [41]. The N. maculatus is a very good example of this general observation; whilst the n-6 was low at 8.15% - 10.4% (total), it was 34.9% - 36.2% (total) in the n-3 values (Table 2). There were two early longterm studies of the beneficial effects of eating fish with regard to the incidence of heart attacks [30]. One was carried out in a period of 19 years in Seattle (Washington) [42], the other was in a period of 20 years in Zutphen (The Netherlands) [43]. Both projects clearly showed that consumption of fish can reduce the risk of ischemic heart diseases. This assertion was further established by Danish research on Eskimo food in Greenland [44]; in Japan this was also noticed between families of fisherman living along the coast and farmer families [45].
Both EPA and DHA have an antithrombotic effect, and it was in a clinical test that high concentrations (1.80g per day for four weeks) of eicosapentaenoic acid ethyl ester made from sardine oil were able to suppress platelet aggregation [44]. Further extensive research on the beneficial effect of n-3 fatty acids from fish oils on the prevention of atherosclerosis was carried out in the USA and other countries like Canada [46], the UK [47], Germany [48] and Australia [49].
The PUFA values relative to the values of SFA had a range of 1.82 - 2.24. The ratio of PUFA/SFA (P/S) in dietary oils is important in determining the detrimental effects of dietary fats. The higher the P/S ratio the more nutritionally useful is the oil. This is because the severity of atherosclerosis is closely associated with the proportion of the total energy supplied by SFAs and PUFA fats [50]. The present P/S varied between 1.82 - 2.24 which is good since it is much more favourable towards PUFA than SFA. Both n-6 and n-3 FAs have critical roles to play in the membrane structure [51] and as precursors of eicosanoids (Fig.1), which are potent highly reactive compounds. Since they compete for the same enzymes and have different biological roles, the balance between n-6 and n-3 FAs in the diet can be of considerable importance [33]. The ratio of n-6 to n-3 or more specifically LA to ALA in the diet should be between 5:1 and 10:1 [33] or 4-10g of n-6 FAs to 1.0 g of n-3 FAs [52]. As LA is almost always present in foods, it tends to be relatively more abundant in animal tissues. In this report C18:2n-6, cis-9, 12 range was 0.7375 - 1.58% whereas the range was 0.3009-0.1452% in C18:3n-3, cis-9, 12, 15. Both these FAs are the biosynthetic precursors in animal systems of C20 and C22 PUFAs, with 3-6 double bonds, via sequential desaturation and chain-elongation steps (desaturases in animal tissues can only insert a double bond) [53], see Fig.2. In Table 4, n-6/n-3 did not meet the normal ratio of 5:1 and 10:1 or 4-10g of n-6 FAs to 1.0 g of n-3 FAs but in LA/ALA, the values of 5.08 - 5.26 fell perfectly within the normal range of 5:1 and 10:1. The ideal is to eat just enough omega-6(s) to function, but not more, and to balance them with lots of omega-3(s). For most people, an omega-6 to omega-3 ratio of 4:1 is ideal: that’s 4 omega-6s for every 1 omega-3. Anti-aging experts suggest going even further, maintaining a 1:1 ratio or higher in favour of omega3s. The average American eats a ratio of anywhere from 12:1 to 25:1 omega-6 to omega-3. A big reason for the skewed ratio in the US and other countries that eat Western diets is the types of oil in our foods. The most common source of omega-6s is linoleic acid, found in corn oil, soybean, safflower oil, cotton seed oil, sunflower oil, poultry, some nuts and seeds.
Phospholipid compositions have direct correlations to the relative proportion of MUFA/SFA and changes to this ratio have been claimed to have effects on such disease states as cardiovascular disease, obesity, diabetes, neuropathological conditions and cancer. They have been shown to have cyto-protective actions in pancreatic β-cells. Cis- Monoenoic fatty acids have desirable physical properties for membrane lipids in that they are liquid at body temperature, but still relatively resistant to oxidation. They are now recognized by nutritionists as being beneficial in the human diet. The MUFA/SFA in Table 4 had values of 1.28 - 1.71 which are good enough. These MUFA/SFA values have good comparisons with MUFA/SFA values in A. montoviae and L. goreensis having levels of 1.16 - 1.78 [12]. The AA/DGLA (C20:4n-6, cis-5, 8, 11, 14/ C18:3n-6, cis-6, 9, 12) values were very high in the samples with values of 91236 - 114623 and CV% of 16.1. A high value of ratio between AA and DGLA, as an indicator of ∆-5 desaturase activity in the skeletal muscle phospholipids has been related to good insulin activity [54]. In assessing the essential PUFA status of an individual, the total amount of the various EFA and PUFA in plasma or erythrocyte phospholipids is a useful indicator [55]. In assessing the EFA and PUFA qualities, the following are further used as additional status markers to reliably assess the functional PUFA status [54]. The best known marker is mead acid [trivial name for all-cis-icosa-5, 8, 11 - trienoic acid (20:3n-9)]. The synthesis of this fatty acid is promoted if there are insufficient concentrations of LA and ALA to meet the need for the synthesis of long-chain PUFA. EPA and DHA inhibit mead acid synthesis; the presence of mead acid indicates a general shortage of all essential PUFA. The results in these analyses had ratios of EPA/DHA as 1.46 - 2.76 and no mead acid was produced. Another suitable indicator of essential PUFA status is the essential PUFA status index (EPSI), which is the ratio between all essential PUFA (the sum of all n-6 and n-3 FAs) and all non-essential unsaturated FAs (the sum of all n-7 and n-9 FAs). The higher the EPSI status indexes the better is the essential PUFA status. All the present EPSI values are greater than average being between 1.31-1.42. Finally, if there is a functional shortage of DHA, the body starts to synthesize the most comparable long-chain PUFA of the n-6 family, osbond acid (C22:5n-6) (all-cis-4, 7, 10, 13, 16-docosapentaenoic acid; a omega-6 fatty acid with the trivial name Osbond acid). It is formed by an elongation and desaturation of arachidonic acid 20:4 omega-6. In mammals, clupanodonic acid deficiency is accompanied by an increase of this isomer; the Osbond/DHA ratio is thus a marker of dietary DHA sufficiency [56]. However, this usage has been questioned [57]. Therefore, under steady state conditions, the ratio between DHA and osbond acid is a reliable indicator of the functional DHA status [58]. No osbond acid in the results, hence the PUFA in the crab samples could not cause functional distress.
The National Institute of Health has published recommended daily intakes of FAs: specific recommendations included 650mg of EPA and DHA, 2.22g/day of ALA and 4.44 g/day of LA. However, the Institute of Medicine has recommended DRI (dietary reference intake) for LA at 12 - 17 and ALA at 1.1 to 1.6g for adult women and men, respectively. It is known that sea-food is the major dietary source of n-3 FAs, a recent fatty acid intake survey indicated that red meat also serves as a slight source of n-3 fatty acids for some population [59]. In the present results EP g/100g in LA ranged from 81.1 – 185mg/100g; ALA range was 16.0 - 35.2mg/100g; in EPA, range was 2490 – 2810mg/100g and DHA range was 1020 – 1710mg/100g. The PUFA content of some selected foods for LA are (mg/100g): beef (muscle only), 80; calf ’s kidney, 61; chicken (breast), 980; chicken (leg), 370; horse meat (average), 160; pork (muscle only), 110; turkey (breast), 180; turkey (leg), 750; veal (muscle only), 197. For ALA (mg/100 g): calf ’s kidney, 61; chicken (breast), 2.7; chicken (leg), 10; horse meat (average), 260; pork (muscle only), 25 and veal (muscle only), 9.1 [60]. The EP g/100g in LA and ALA were highly comparable to most of the literature values just cited.
The metabolisable energy in food is held in the form of fat, carbohydrate, protein and alcohol. A gramme of fat contains approximately 9 kilocalories or (37kJ) of energy [61]. This conversion factor was used to calculate the energy levels of the various samples. The energy density on the samples ranged as the fatty acids/ EP g/100g values. In the male sample significant energy levels ranged from 1.30kJ/100g (0.3168 kcal/100g) - 92.1kJ/100g (22.4kcal/100g) or a total of 433kJ/100g (105kcal/100g) (Table 5). In the female sample the metabolisable energies ranged from 1.72kJ/100g (0.4185kcal/100g) – 104kJ/100g (25.3kcal/100g) or a total of 407kJ/100g (99.0 kcal/100g) (Table 6). The 1990 Canadian RNI (Recommended Nutrient Intakes) included specific amounts for 3n-3 fatty acids and 2n-6 fatty acids. For n-3 FAs, the RNI is 0.5% of total energy or 0.55g/1000kcal [62]. For energy contribution in the samples, the following was observed: in the male [n-3 PUFA (total)] > MUFA (total) > SFA> n-6 PUFA (total); in the female [n-3 PUFA (total)] > MUFA (total) > SFA > n-6 PUFA (total). The metabolisable energy trend in both the male and female innards of N. maculatus followed the exact trend as observed in A. monroviae [12]. On the total energy from the samples coming from the unsaturated FAs, the trend was female (79.8%) > male (75.6%). In these samples, the n-3 FAs contributed 34.9 - 36.2% of total energy, whereas n-6 FAs contributed 8.15 - 10.4% of total energy. These groups energy contributions are highly comparable to the values observed in another lagoon fin fish: A. monroviae and L. goreensis [12] having the following trend values: n-3 FAs contributed 14.8 - 35.8%, n-6 FAs contributed 6.41 - 6.82% and SFA contributed 26.9 - 28.3%.
It is noted from above that total energy contributed was 433kJ/100g (105kcal/100g) in the male sample and 407kJ/100g (99.0kcal/100g) in the female. For optimum weight loss, reduce your overall fat/oil consumption to a sensible level. A level of 15% - 20% of your total calories should come from fat-and majority of that should be essential fatty acids. In determining how many grammes of fats this translates into, you multiply your total daily calories by 15% (20% for the high end of the range) and then divide by 9, which is the number of calories in a gramme of fat. Here is an example: 2500 daily calories × 0.15 = 375/9 = 41.7 or 42g of total fat per day-the bulk of which should be EFAs. It is known that 20% energy from fat is consistent with good health. With 41.7g of total fat per day, the samples with values of 11.0 - 11.7g/100g (26.4% - 28.1% of 41.7g of total fat per day) fatty acids would be able to provide at least a quarter of the daily needs of energy to its consumers.
Cholesterol is known to be a high molecular weight alcohol which is manufactured in the liver and in most human cells. Just like the SFA and PUFA, the cholesterol we make and consume plays many vital roles. In conjunction with SFA, cholesterol in the membrane gives our body cells necessary stiffness and stability. When diet contains an excess of PUFA, these replace SFA in the cell membrane, so that the cell wall actually becomes flabby. When this happens, cholesterol from the blood is “driven” into the tissues to give them structural integrity. This is why serum cholesterol levels may go down temporarily when we replace SFA with PUFA oils in the diet [63]. Other functions of cholesterol in human body include the followings:
Cholesterol acts as a precursor to vital corticosteroids, hormones that help us deal with stress and protect the body against heart disease and cancer; and to the sex hormones like androgen; precursor to vitamin D, a very important fat soluble vitamin needed for healthy bones and nervous system; proper growth; mineral metabolism; muscle tone; insulin production; reproduction and immune function. The bile salts are made from cholesterol. Bile is vital for digestion and assimilation of fat in the diet. Cranton et al. [64] show that cholesterol act as an antioxidant. This gives a likely explanation for the fact that cholesterol levels go up with age. As an antioxidant, cholesterol protects us against free radical damage that leads to heart disease and cancer. It is needed for proper function of serotonin receptors in the brain [65]. Low cholesterol levels have been linked to aggressive and violent behaviour, depression and suicidal tendencies. Mother’s milk is especially rich in cholesterol and contain a special enzyme that helps the baby utilize this nutrient. Babies and children need cholesterol-rich food throughout their growing years to ensure proper development of the brain and nervous system. Dietary cholesterol is known to play an important role in maintaining the health of the intestinal wall [66]. This is why low-cholesterol vegetarian diets can lead to leaky gut syndrome and other intestinal disorders. Just like fats, cholesterol is liable to damage on exposure to heat and oxygen. This damage or oxidized cholesterol seems to promote both injury to the arterial cells as well as a pathological buildup of plague in the arteries [67].
The PC is the building block of membrane bilayers, it is also the principal phospholipids circulating in plasma, where it is an integral component of the lipoproteins, especially the HDL [62]. Cephalin (phosphatidylethanolamine, PE) occupied the second highest concentrated position with values of 91.1mg/100g (24.9%) - 118mg/100g (26.1%); cephalin followed lecithin in A. monroviae and L. goreensis [12] as they occurred in the present samples. PE is found in all living cells, although in human physiology it is found particularly in nervous tissue such as the white matter of brain, nerves, neural tissue and in spinal cord [68]. Phosphatidylserine [Ptd-L-Ser (PS)] occupied the third position in the concentration series in both samples: 38.0mg/100g (10.4%) -43.4 mg/100g (9.60%) with CV% of 9.43 and difference of - 14.3%. PS has been shown to enhance mood in a cohort of young people during mental stress and to improve accuracy during tee-off by increasing the stress resistance of golfers. The US Food and Drug Administration (USFDA) had stated that consumption of PS may reduce the risk of dementia in the elderly [68]. Phosphatidylinositol (PI or PtdIns) occupied the fourth important position in concentration in the two crab samples having concentration range of 12.0mg/100g (3.27%) - 13.6mg/100g (3.01%) with CV% of 8.99 and difference of - 13.6%. PI is a negatively charged phospholipid. PI is capable of being phosphorylated to form phosphatidylinositol phosphate (PIP), phosphatidylinositol bisphosphate (PIP2) and phosphatidylinositol trisphosphate (PIP3). PIP, PIP2 and PIP3 are collectively called phosphoinositides. Phosphoinositides play important roles in lipid signaling, cell signaling and membrane tracking [68]. Lysophosphatidyl-choline had no significance in the total phospholipid concentration as it occupied the last and insignificant fifth position with values of 6.15e-1mg/100g (1.68e-1%) - 7.69e-1 mg/100g (1.70e-1%). Partial hydrolysis of PC with the removal of only one fatty acid yields a lysophosphatidylcholine.
The literature report of Viswanathan Nair and Gopakumar [69] on lipid and fatty acid compositions of five species of lean fish, silver hew fish (Johnius argentatus), milk fish (Chanos chanos), pearl spot (Etroplus suratensis), cat fish (Pseudarius jella and Tachysurus sp) and three species of shell fish, mussed (Perna viridis), crab (Neptunus pelagicus) and fresh water prawn (Macrobrachium rosenbergii) showed that PC was the major phospholipid in all the samples studied. In lean fish, its proportion varied from 55.9 - 63.8% and in shell fish, from 44.0 - 68.9% of total phospholipids. PE content was the second highest component (except in fresh water prawn). Its proportion in lean fish varied from 14.9 - 21.7% of total phospholipids. Fresh water prawn was notable for its very low content of phosphotidyethanolamine (8.60%). Ptd-L-Ser (PS), PtdIns (PI) and small quantities of lyso-derivatives of phosphatidylcholine and PE were also present in the samples.
The biological effects of EPA and DHA have been widely investigated as well as their impact on lipoproteins,
blood pressure, cardiac function, endothelial function, vascular reactivity, asthma and anti-inflammatory effects
[70-73]. With expanding public awareness of the health benefits of EPA/DHA, there is an urgent need
to locate and appropriate source(s). N. maculatus from this report has been shown to be a valuable source of
PUFA oil. For quantitative extraction of the lipid from N. maculatus, the following extraction methods are
suggested: agitated extraction (AE), Ultrasonic extraction (UE), Soxhlet extraction (SE) and homogenizer
extraction (HE). The lipid can then be refined through degumming, neutralization and bleaching to produce
high quality Neopetrolisthes maculatus oil [74].
In pursuance of quality assurance for the analysis, correlation coefficients (Cc) were determined for all the
standards: fatty acids, phospholipids and sterols. The Cc values for the standards ranged as follows: 0.99833
- 0.99997 (fatty acids), 0.99909 - 0.99999 (phospholipids) and 0.99920 - 0.99994 (sterols); all the correlation
values were greater than 0.95 which is the critical correlation for acceptance of these types of analytical
results. This attested to the quality assurance of the determinations.
Conclusions
The use of omega-3 oils/long-chain omega-3 PUFA constitutes one of the most promising development in
human nutrition and disease of their effectives in prevention and treatment of coronary heart disease [75],
hypertension [76], diabetes [77], arthritis and other inflammations [78], autoimmune disorders [79], mental
health and neural function as in depression and schizophrenia [80] and cancers [81,82] and are essential for
maintenance and development of normal growth, especially for the brain and retina [83].
This study showed that the samples contained slightly unequal distribution of all the parameters determined. These trends were observed in the study: Total FA from crude fat: male > female; crude fat: male > female; crude fat energy: male > female; total FA energy: male > female; SFA: male > female. On the other hand, female > male in the following parameters: total MUFA, total n-6 PUFA, n-3 PUFA (total), n-6 + n-3 PUFA, total unsaturated fatty acids, AA/DGLA, EPA/DHA, PUFA/SFA, MUFA/SFA, n-6/n-3, C16: O: C18: 1 cis-9, % C16:O in SFA. The sterols were low but higher in female than male. All the quality parameters for the samples were good with most of values being better in female than the male sample. Both samples can serve as direct sources of EPA and DHA and their extraction and purification for other nutritional benefits. All statistical analyses at r=0.01 showed that significant differences occurred in the various parameters among the innards of the heterosexual Neopetrolisthes maculatus.
Conflict of Interests
The authors declare no conflict of interest.
Bibliography


Hi!
We're here to answer your questions!
Send us a message via Whatsapp, and we'll reply the moment we're available!