Biography
Interests
Starcevic, K.1, Mauric, M.2, Vranic, M.3, Bosnjak, K.3, Didara, M.4, Speranda, M.4, Stojevic, Z.5 & Masek, T.6*
1Department of Forensic and State Veterinary Medicine, University of Zagreb, Faculty of Veterinary Medicine,
Zagreb, Croatia
2Department of Animal Husbandry, University of Zagreb, Faculty of Veterinary Medicine, Zagreb, Croatia
3Department of Crop, Forage and Grassland Production, Faculty of Agriculture, Centre of Grassland Production,
University of Zagreb, Zagreb, Croatia
4Department of Animal Science, Faculty of Agriculture, University of Osijek, Osijek, Croatia
5Department of Physiology and Radiobiology, Faculty of Veterinary Medicine, University of Zagreb, Zagreb,
Croatia
6Department of Animal Nutrition and Dietetics, University of Zagreb, Faculty of Veterinary Medicine, Zagreb,
Croatia
*Correspondence to: Dr. Masek, T., Department of Animal Nutrition and Dietetics, University of Zagreb, Faculty of Veterinary Medicine, Zagreb, Croatia.
Copyright © 2019 Dr. Masek, T., et al. This is an open access article distributed under the Creative Commons Attribution License, which permits unrestricted use, distribution, and reproduction in any medium, provided the original work is properly cited.
Abstract
We have investigated the effects of severe and mild hyperglycemia with insulin resistance on the fatty acid profile of the liver and brain tissue. For this purpose, a single, intraperitoneal dosage of streptozotocin (STZ, 55mg/kg) was used to induce severe hyperglycemia, characteristic for type 1 diabetes mellitus (T1DM) (H-STZ group), while a low dosage of STZ (35mg/kg) and fructose in drinking water was used to mimic mild hyperglycemia and insulin resistance characteristic for the type 2 diabetes mellitus (T2DM) prediabetic state and metabolic syndrome (L-STZ-FRU group).
The content of fatty acids varied significantly depending on the treatment, as well on the lipid class and origin (whole cell or microsomes). The variations in the brain fatty acids were much less pronounced and they depended on the brain region. The most significant changes, in the liver tissue of the H-STZ rats were a decrease in monounsaturated fatty acids (MUFA), particularly palmitoleic and cis-vaccenic, while these fatty acids increased in the L-STZ-FRU rats. In the brain tissue of the H-STZ rats the most significant changes included an increase in linoleic acid, while in the L-STZFRU rats the changes were minimal. Arachidonic acid decreased in the liver phospholipids of the H-STZ group due to the partitioning into neutral lipids, and in the L-STZ-FRU rats it decreased in liver phospholipids, brain cortex and medulla. The content of docosahexaenoic acid increased in the cerebellum and medulla of the H-STZ rats and decreased in the liver phospholipids of the L-STZ-FRU rats.
The influence of hyperglycemia on the fatty acid profile of the liver and brain tissue demands additional investigation, especially in T2DM and metabolic syndrome. However, the presented data could improve knowledge on supplementation of patients with adequate dietary fatty acids.
Introduction
Fatty acids present in the body originate from the diet, de novo lipogenesis and bioconversion. Within the
living organism, fatty acids perform different roles, including energy reserves, structural components of
biological membranes and regulation of membrane fluidity, cell signaling and regulation of gene expression
[1]. Bioconversion of fatty acids includes elongation, desaturation and β-oxidation steps for shortening. All
these processes are highly regulated by the activity of desaturases and elongases, metabolites, transcriptional
factors, substrate availability (diet), microRNA and β-oxidation (mitochondria and peroxisomes) [2].
Different metabolic diseases (diabetes mellitus type 1, T1DM; type 2, T2DM and metabolic syndrome, MetS) extensively change the bioconversion of fatty acids. In rodent models of T1DM, de novo lipogenesis and desaturases activity significantly decreases [2,3]. Consequently the content of palmitic and monounsaturated fatty acids regularly decreases [4-7]. The decrease in arachidonic acid (ARA) content has been less constant in trials, but there is a regular increase in its precursors (linoleic acid, LA and dihomo-gamma-linolenic acid, DGA) [2-5]. Interestingly, the content of docosahexaenoic acid (DHA) is often increased during T1DM, despite the decrease in desaturation [3,8].
In T2DM and MetS changes are less constant and depend on the experimental model used. In trials with a high content of carbohydrates in the diet, there is an evident increase in desaturase activity in contrast to T1DM, an increase in the content of oleic acid, and a decrease in the content of LA [4,7-10]. In MetS or T2DM induced by a high fat diet, different changes could be expected, including a decrease in ARA content [11]. Direct comparison of high fat and high carbohydrate diets in the same trial reveals significant changes in desaturation, SFA and MUFA content, but also in individual fatty acids [12]. With the introduction of combined streptozotocin and high fat or fructose diets, as an experimental model, further variability in the investigation of fatty acid profiles during metabolic diseases was introduced [13].
Our trial was performed to study directly the changes in the fatty acid profile of the liver and brain during severe hyperglycemia, induced by a high dosage of streptozotocin, in contrast to mild hyperglycemia induced by a low dosage of streptozotocin, combined with a high content of fructose in the diet.
Materials and Methods
In total, eighteen male Wistar rats, were used in the experiment conducted at the laboratory animal facilities
of the Institute for Medical Research and Occupational Health, Zagreb, Croatia. The experiment was
approved by the Croatian National Ethics Committee and the Ministry of Agriculture, Republic of Croatia
(authorization EP 13/2015). The rats were fed the basic rodent feed (20% crude protein, 5% crude fat and
5% crude fiber).
The rats were divided into three groups (six rats per group) according to treatment (Table 1). The control group (CON) was fed the basal diet and did not receive streptozotocin (STZ) treatment. The severe hyperglycemia group (H-STZ) was fed the basal diet and on the 15th day was treated with a high STZ dosage (55mg/kg of STZ) as previously described [3] to induce T1DM. The mild hyperglycemia group (L-STZ-FRU) was fed the basal diet, received 10% (w/v) of fructose in the drinking water, and on the 15th day was treated with a low STZ dosage (35mg/kg of STZ) to induce a state resembling prediabetes and metabolic syndrome.
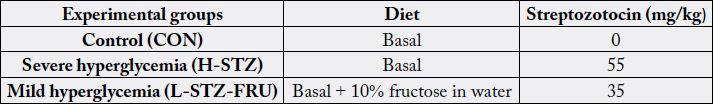
All rats were weighed daily at 8.00 hours using an electronic balance, and at the same time non-fasting blood glucose levels were determined using an Accu-Chek Go [14].
On the 45th day of the experiment all the rats were sacrificed under Narketan/Xylapan anesthesia (Narketan®, 80mg kg-1 b.m. and Xylapan®, 12mg kg-1 b.m., i.p., Vétoquinol, Bern, Switzerland) by exsanguination. Immediately after the animals were sacrificed, the liver and the brain tissues were frozen in liquid nitrogen and kept at -80ºC for extraction and quantification of fatty acids. The pancreatic tissue was stored in 4% neutral buffered formaldehyde for histological assessment.
The pancreatic tissue fixed in 4% neutral buffered formaldehyde was embedded in paraffin, sectioned into 5μm thick sections, and stained routinely with hematoxylin and eosin (H&E).
Total lipids (TL) from the liver and brain were extracted with chloroform/methanol (2:1, v/v) [15]. Total lipid extracts were dried under N2, resuspended in 200μl of chloroform-methanol (2:1, v/v) with added BHT and stored at -80ºC. Total phospholipids (PL) were separated by solid-phase extraction on a 500mg aminopropyl bonded silica cartridge (Supelclean, Supelco, Bellefonte, PA, USA) using chloroform/isopropanol (2:1, v/v) for neutral lipids and methanol for phospholipids. Total phospholipidids were dried, resuspended and stored as described above.
Fatty acids from the TL and PL were transmethylated using 2M KOH in methanol for 15min at room temperature, extracted in n-hexane, dried, resuspended and transferred into vials for GC-MS analyses. Fatty acid methyl esters were quantified by GC-MS (QP2010 Ultra, Shimadzu, Kyoto, Japan), using a BPX70 capillary column (0.25mm internal diameter, 0.25μm film thickness, 30m long, SGE, Austin, TX, USA) as previously described [16]. The fatty acid composition of the examined lipids was expressed as the mole percentage of total fatty acids.
Experimental results were analyzed using the GraphPad Prism 8 program. Data were expressed as the means ± SD. ANOVA and the post-hoc Tukey test were used for comparing data obtained from independent samples. Significance was established at p < 0.05.
Results
The blood glucose level was measured for all experimental groups between the 15th and 45th day (Figure
1a). The H-STZ group had high glucose values immediately after the STZ treatment, and constantly above
25mmol/l, indicating severe hyperglycemia. Glucose values in the L-STZ-FRU group increased after the
40th day of the trial and ranged from 8.9 (minimum) to 10.8 (maximum), indicating mild hyperglycemia.
Insulin values in the H-STZ group were below 60% of the CON group, while in the L-STZ-FRU they
were below 90% of the CON group.
The body weights of the rats significantly decreased only in the H-STZ group compared to the CON group. Similarly, the liver and brain weight decreased in the H-STZ group compared to the CON group. The liver weight index significantly decreased in the L-STZ-FRU group, while the brain weight index significantly increased in the H-STZ group compared to the CON group (Figure 1e-i).
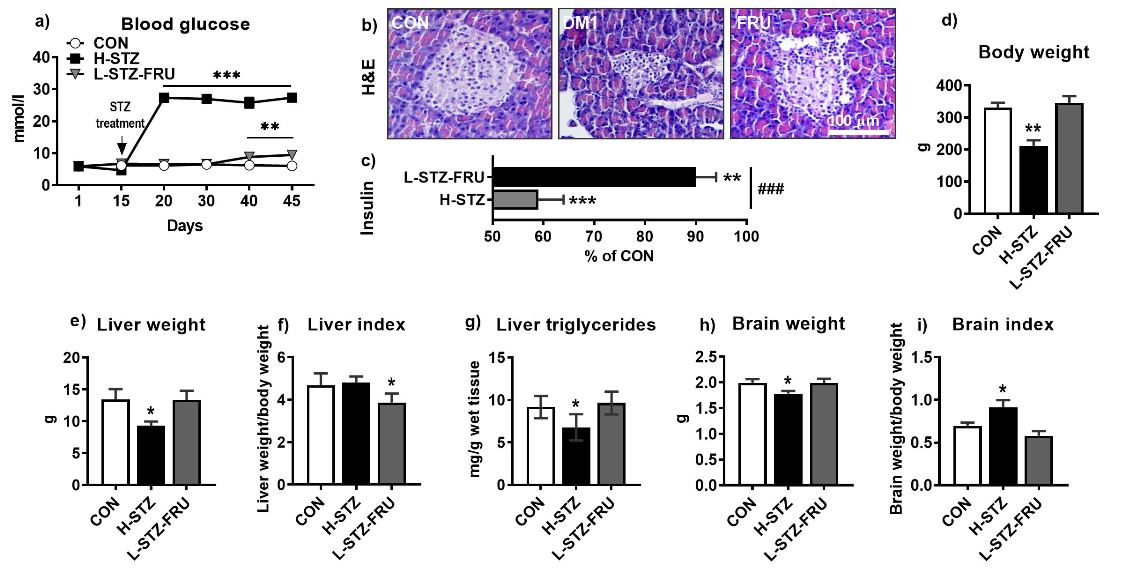
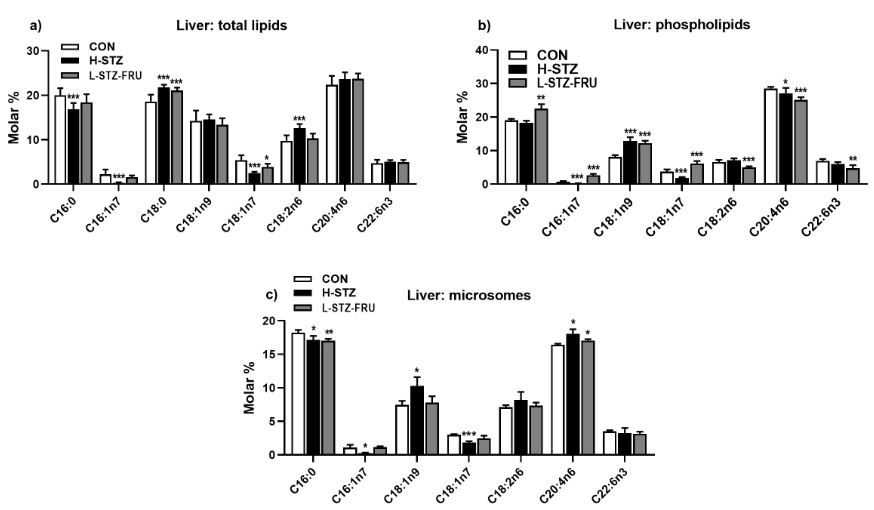
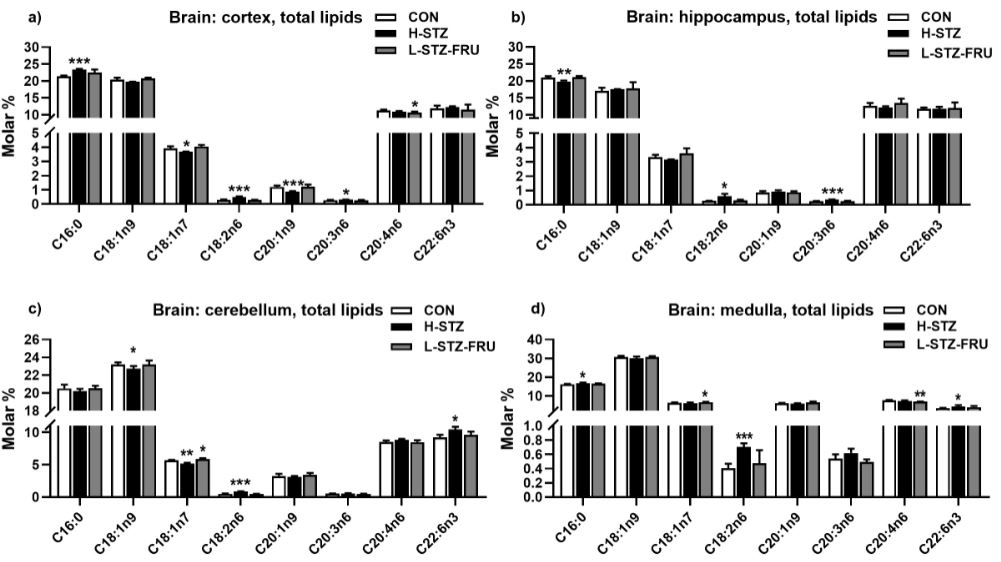
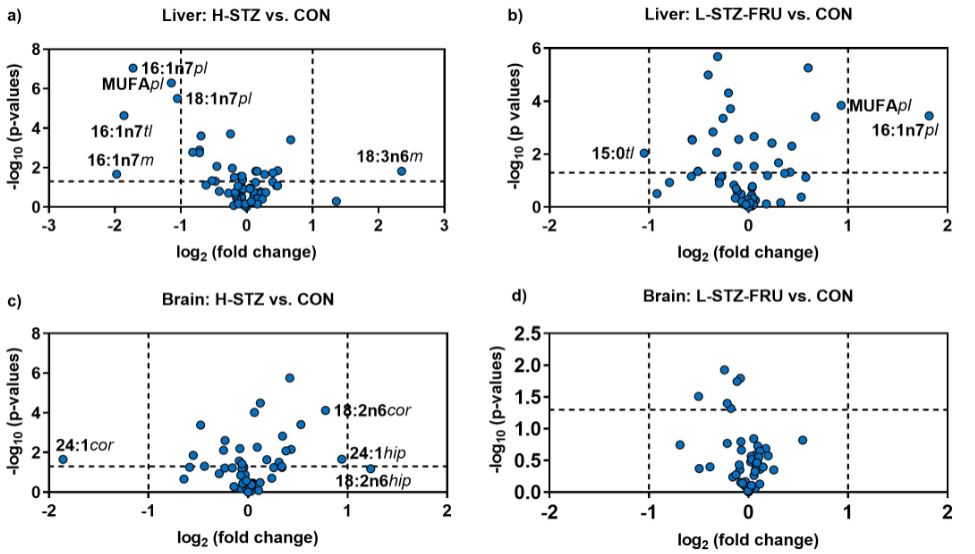
Liver triglyceride values decreased in the H-STZ group compared to the CON group (Figure 1g). Individual fatty acids varied significantly depending on the treatment as well on the lipid class (TL and PL) and origin (whole cell or microsomes) (Figure 2a-c). The variations in the brain fatty acids were much more subtle and depended on the brain region (Figure 3a-d). The most significant changes in the liver tissue of the H-STZ rats were a decrease in monounsaturated fatty acids (MUFA), particularly 16:1n7 and 18:1n7 (Figure 4a), while those fatty acids increased in the L-STZ-FRU rats (Figure 4b). In the brain tissue of the H-STZ rats, the most significant changes included an increase in linoleic acid (Figure 4c) while in the L-STZ-FRU rats the significance of the changes was much lower (Figure 4d).
Discussion
In our trial, a single, intraperitoneal dosage of STZ (55mg/kg) was used to trigger severe hyperglycemia
characteristic for T1DM, while a low dosage of STZ (35mg/kg) and fructose in drinking water was used
to mimic mild hyperglycemia and insulin resistance characteristic for the T2DM prediabetic state and
metabolic syndrome. As a result, we obtained rats with severe and mild pathological changes in the pancreatic
islets. Similarly, insulin values were very low in severe hyperglycemia and only slightly decreased (≈90 of
Control) in mild hyperglycemia. Body weight, liver weight and brain weight were significantly influenced
only by severe hyperglycemia. The decreased body growth and decreased weight of the organs is a usual
characteristic of drastic hyperglycemia in T1DM models [4,17-19].
The fatty acid profile in T1DM follows a specific pattern, while in T2DM the pattern is much more variable. The severe hyperglycemia present in T1DM causes a characteristic decrease in the concentration of palmitic acid in the liver tissue due to the loss of the lipogenic influence of insulin. The SREBP1c transcription factor is essential for lipogenesis and fatty acid homeostasis, and its expression decreases due to the lack of insulin action [20]. The decrease in palmitic acid is much less evident in the brain and it depends on the brain region. In mild hyperglycemia, the content of palmitic acid could be increased due to the highly lipogenic fructose [10].
The content of liver tissue monounsaturated fatty acids is characteristic during hyperglycemia. In severe T1DM hyperglycemia, the content of palmitoleic acid is decreased in all lipid classes. In the brain, that decrease is less obvious, because palmitoleic content is low in brain tissue. Another characteristic monounsaturated fatty acid is cis-vaccenic (C18:1n7), which also decreases in the liver and in the brain cortex and cerebellum. In contrast, during mild hyperglycemia, the content of palmitoleic and cis-vaccenic acid is relatively unchanged or even increases (liver phospholipids, cerebellum, medulla). The underlying cause of the differences in the content of monounsaturated fatty acids are the differences in the expression of Δ9-desaturase, which decreased in severe T1DM hyperglycemia [4,21] but increased in the carbohydrate supplemented rats (fructose or sucrose) [8,10]. The specific content of palmitoleic acid tissue during T1DM or T2DM, and metabolic syndrome and its strong response to Δ9-desaturase expression, makes it an interesting biomarker in metabolic diseases [2].
In individual polyunsaturated fatty acids, specific changes also occur during hyperglycemia. One of the specific fatty acids is linoleic (C18:2n6), whose content is increased in severe hyperglycemia due to the blocked conversion into fatty acids with more double bonds and carbon atoms. The conversion is blocked due to the decreased activity of Δ5 and Δ6 desaturases [7,22]. The increase in linoleic acid during severe hyperglycemia was even more pronounced in the brain where it was present in all four regions examined.
The important polyunsaturated fatty acids, arachidonic and docosahexaenoic also change in a hyperglycemic state. Several authors found a decrease in arachidonic acid content during streptozotocin induced T1DM, in liver phospholipids [23,24]. Nevertheless, a significant partitioning of arachidonic acid into neutral lipids is present in streptozotocin T1DM [2,5,25]. Besides partitioning, the n6/n3 ratio could also influence arachidonic acid content during T1DM [2]. Interestingly, the content of docosahexaenoic acid could increase in T1DM despite the decrease in desaturase activity [8]. Possible explanations are increased peroxisomal β-oxidation [13] and the influence of the n6/n3 ratio on desaturase expression [2]. Our data also showed an increase in docosahexaenoic acid content in the medulla and cerebellum, but without a change in the liver tissue. The content of arachidonic and docosahexaenoic acid in T2DM and metabolic syndrome depends on the experimental model and dietary treatment used to induce the metabolic disease. When using high STZ dosage alone or with additional supplementation with high fat, the addition of fat causes a decrease in arachidonic acid [11]. Dietary treatments without STZ also result in different behavior of docosahexaenoic and arachidonic acids. Arachidonic acid content increases with a high-fat and high-carbohydrate diet, while docosahexaenoic acid increases with a high-fat diet, and decreases with a high-carbohydrate diet [12]. Our data also showed a decrease in phospholipid docosahexaenoic acid content in fructose treated rats, similar to the trial of [4]. Data on a high content of sucrose in the diet showed a decrease in docosahexaenoic acid content and no change in arachidonic acid content [8]. In contrast, trials with sucrose overload via the drinking water showed a significant decrease in the content of arachidonic acid, without any change in docosahexaenoic acid content [9,10].
Conclusions
In conclusion, changes induced by hyperglycemia occur relatively early after 30 days of treatment, with more
pronounced changes in the liver than in the brain. The most important changes in the liver tissue during
severe T1DM hyperglycemia include a decrease in palmitic, palmitoleic and cis-vaccenic acids, and an in mild hyperglycemia, characteristic for the prediabetic state and metabolic syndrome, the changes in
palmitoleic and cis-vaccenic acids are reversed. The content of arachidonic and docosahexaenoic acids
mostly remains unchanged during hyperglycemia, however, arachidonic acid could decrease in both severe
and mild hyperglycemia, while docosahexaenoic acid could increase during severe hyperglycemia and
decrease during mild hyperglycemia. Although the influence of hyperglycemia on fatty acid profile needs
additional investigation, especially in T2DM and metabolic syndrome, the results presented could improve
the knowledge on the supplementation of patients with adequate dietary fatty acids.
Acknowledgements
This work has been fully supported by the Croatian Science Foundation as part of the project IP-2014-09-
8992 awarded to Tomislav Mašek.
Conflicts of Interests
The authors declared no conflict of interest
Bibliography


Hi!
We're here to answer your questions!
Send us a message via Whatsapp, and we'll reply the moment we're available!