Biography
Interests
Perera, M. A. K. K. P.
Division of Food and Water, Department of Government Analyst’s, Sri Lanka
*Correspondence to: Dr. Perera, M. A. K. K. P., Division of Food and Water, Department of Government Analyst’s, Sri Lanka.
Copyright © 2018 Dr. Perera, M. A. K. K. P. This is an open access article distributed under the Creative Commons Attribution License, which permits unrestricted use, distribution, and reproduction in any medium, provided the original work is properly cited.
Abstract
Rice is the most important food for the world population including Sri Lanka. However, the toxic metallic elements in rice grains transferred from environment or as an agriculture input often pose great risk to human health because their toxicity, persistence and bioaccumulation in body. Aimed of this study is to investigate the suitability of microwave assisted-acid digestion sample preparation method as a rice sample preparation method as well as to validate the method for monitoring the concentration of arsenic (As) and cadmium (Cd) in rice using Inductively Coupled Plasma Mass Spectroscopy (ICP-MS). The analytical method was validated by measuring several parameters including limit of detection (LOD), limit of quantification (LOQ), linearity, recovery and repeatability. Regarding the sample preparation, recoveries of spiked samples were within the acceptable range from 83.5 to 114.2% for both As and Cd. Validation parameters showed that the method fits for its purpose, being As and Cd within the limit established by CODEX Alimentarius. The method was applied for analyzing 71 rice samples (42 red raw, 27 white raw and 2 parboiled) consumed by Sri Lankan population. Arsenic and cadmium concentrations of all analyzed samples were lower than the established maximum values.
Introduction
Of the ninety (90) naturally occurring elements, seventeen (17) (C, H, O, N, P, S, Ca, Mg, K, Cu, Zn, B, Fe,
Mo, Cl, Mn and Ni) are essential for plant life [1], whereas for humans twenty five (25) elements (C, H, N,
O, S, P, K, Mg, Ca, Cl, Na, f, Si, V, Cr, Mn, Fe, Co, Ni, Cu, Zn, Se, Mo, Sn and I) are currently known to be
essential [2]; in addition, two other elements, Al and Li, have recently been included as possibly essential
[3,4]. The twenty five (25) essential elements include four (04) light metals (Na, K, Mg and Ca) and ten
(10) heavy metals (Cr, Mn, Fe, Co, Ni, Cu, Zn, Se, Mo and Sn). Food contains most of the above essential
metallic elements. These elements are essential in trace quantities for maintenance of cellular processes. The
major entry of trace elements into body is through diet. But their excesses, imbalances or deficiencies can
results in adverse effects on living system [5,6]. Other metallic elements such as mercury (Hg), lead (Pb),
cadmium (Cd), tin (Sn), arsenic (As) etc., have no functional effects in the body and can be harmful to
health if foodstuffs containing them are consumed regularly in the diet. Therefore, they are considered as
toxic elements [6].
The toxic elements such as cadmium (Cd) and arsenic (As), coming mainly from mining, industrial processes, pesticides, chemical fertilizers and atmospheric decomposition due to the occurrence of industrialization and urbanization without environmental care [7,8]. Toxic elements accumulation in environment is a health hazard due to their persistence, bioaccumulation and toxicity to plant, animal and human beings [9]. An increase in the concentration of a material in a living being over time compared to the concentration of that in the environment is defined as bioaccumulation [8,10]. These toxic elements transported from aquatic media to foodstuffs due to ingestion of foods grown in contaminated soils [11]. It was intensively investigated that uptake of metals by plants depends on the physico-chemical makeup of plant and soil [12]. It has been shown that plants growing in soil contaminated with toxic elements are not capable of preventing their uptake and accumulation in the plant tissue, but are capable of restricting them only [13].
Toxic elements are considered highly hazardous to human health and they may cause acute and chronic poisoning. The principal toxic effect of cadmium (Cd) is its toxicity to the kidney, although it has also been associated with lung damage (including induction of lung tumours) and skeletal changes in occupationally exposed populations. Cadmium is relatively poorly absorbed into the body, but once absorbed is slowly excreted, like other toxic metals and accumulate in the kidney causing renal damage. The kidney of the food animals is a major source of cadmium in the diet although lower levels are found in many foods [6,7]. Arsenic exists both in inorganic and inorganic forms and also in different valence states. Inorganic arsenic is significantly more toxic than organic arsenic compounds such as dimethylarsinate and in turn the trivalent forms of arsenic, e.g. arsenic trichloride, are more toxic than the pentavalent arsenate. The latter are considered to be toxic only after metabolic conversion to the trivalent form of arsenic [6,7]. It has been reported that population are extensively vulnerable to exposure of these toxic elements because of their immature renal system and exhibit a narrow tolerance to these non-essential elements [14]. Therefore some international organizations such as Food and Agricultural Organization (FAO) or World Health Organization (WHO) have identified the Maximum allowable concentration (MAC) in rice [10] and maximum limits in rice [15,16].
Rice (Oryza sativa L.) is the most important food for the world population [17] and one of the most consumed cereals in the world [18], it is part of the staple diet of the world population; it is considered as the most important source of nutrients for billions of people around the world [19]. Rice, being a staple in the diet of many people in Asian countries, supplies a major proportions of the total daily intake of major and trace elements by these people [5] and according to report of FAO, rice provides 30.0% of energy and 20.0% of the daily requirement of protein for adults [10,8,18]. Rice is a rich source of manganese, selenium, magnesium and other essential minerals necessary to body [10]. According to the literature review carried out by Meharg and co-workers, rice roots and grains take up a lot of arsenic than wheat and barley from the soil, even though wheat and barley have been found growing on much more contaminated soil compared to rice [20].
High concentrations of toxic elements are found in rice when compared to other plant grown under the normal conditions. Many toxic elements accumulation in rice is associated with the plant characteristics and its cultivation, as it is usually grown in flooded or very humid areas, which optimize the transfer of such elements from soil to the plant [21]. Only fish and seafood may carry higher concentration of arsenic than rice; however, while arsenic in rice occurs manly as inorganic arsenic species, which are very toxic, arsenic in fish and seafood occurs primarily as organic spices, which are less toxic [21,22].
Various modern developments in agriculture and technology can affect the trace element content of food. Because of this, concerns have increased over the contamination of crop (rice) plants with various chemical elements by introducing of mechanized farming, the application of agro-chemicals and the processing of foodstuffs (rice) during and after harvest. For instance, water used for irrigation during the cultivation together with the trace element contaminated soil. During the postharvest processing, extent of milling of grains is known to affect the trace element content of the cereals such as rice. Milling not only removes the outer layers of the grain, which are rich in minerals but also could potentially contaminate the rice grain with trace elements [23]. Another widely used postharvest practice is parboiling. In this process, the paddy soaked in ambient water for some time. The concern has been raised about possible contamination of paddy by toxic metals during the process of soaking, if clean water is not used. In order to minimize the adverse impact of these practices, it is important to measure and continuously monitor the concentration levels of trace elements in foodstuffs such as rice [23], as it comprises more than 50% of the average daily intake of the people in Sri Lanka. It is also important to note that some people consume rice or rice- based products for all three meals.
The determination of elements in food samples traditionally been performed by digestion with acid or acid mixtures, which is time consuming and involves some potential drawbacks such as analyte losses and sample contaminations due to contaminated environment. The microwave assisted-acid digestion sample preparation method is also an adequate determinative technique, but it demands skilled sample handling, much time to cool the reactor before opening [24]. The main advantage of microwave assisted-acid digestion sample preparation method is its requirement of a small amount of mineral acid and a reduction in the production of nitrous vapours and reduced the risk of the personnel exposure to it [25].
In this context, the scope of this study was to investigate a suitability of microwave assisted-acid digestion sample preparation method as a rice sample preparation method as well as to validate a method for monitoring the concentration of arsenic and cadmium in rice using Inductively Coupled Plasma Mass Spectroscopy (ICP-MS). The proposed method was applied for analysing different type of rice types (red/brown raw rice and white raw rice) coming from various regions of Sri Lanka in order to assist the Sri Lankan regulatory bodies to establish the maximum levels of cadmium and arsenic in rice in Sri Lanka.
Materials and Methods
High purity deionized water (resistivity 15 megohmcm-1) that was obtained from a Elix Essential 5 (UV)
millipore water purification system (Millipore SAS, Molsheim, France) was used throughout this study.
Multi-elements standards solution containing cadmium (111Cd) and Arsenic (75As) at 10mg/L, multielement
internal standard solution containing germanium (72Ge) and indium (115In) at 10mg/L and ICPMS
instrument optimization solution (Tuning solution) at 1μg/L (140Ce - celenium, 60Co- cobolt, 7L -
lithiumi, 12Mg - magnesium, 205Tl – thalium and 39Y -yttrium ) were purchased from Agilent Technologies
(Singapore) and traceability estimated for all three solutions with respect to NIST. All of the used reagents
were of analytical grade. Trace SELECTTM 69% nitric acid (HNO3) (Fluka Aanlytical, Sigma-Aldrich,
USA) and ACS 30% hydrogen peroxide (H2O2) used in the digestion procedures.
External calibration was performed using a six-point standards curve, of which one is reagent blank (2% HNO3), prepared by serial dilution of multi-element standards solution with 2% (v/v) HNO3. Calibration (analytical) curve concentrations ranged from 1.0 to 50.0μg/L (ppb) for both cadmium and arsenic.
A multi-element (germanium for arsenic and indium for cadmium) internal standard solution with 10μg/L of each element in 2% (v/v) HNO3 solution was prepared by dilution of 10mg/L. Internal standard solution was added in-line to the analysed solution through a mixing tee, used to blend in the internal standards with the samples after the peristaltic pumping and before the nebulizer.
Purity of the plasma gas (Ar - argon) and collision gas (He - helium) was greater than 99.999%.
All lab ware was soaked in a 10% (v/v) HNO3 acid solution bath for 24hr and was rinsed with high purity deionized water. Subsequently, all materials were dried under clean-air at ambient temperature.
The acid digestion of the rice samples were performed using a commercial high-pressure laboratory
microwave system (TOP wave microwave for pressure digestion, analytikjena, Analytik Jena AG, Jena)
operating at a frequency 50/60Hz with a microwave power 1,450W. The microwave digestion system was
equipped with twelve 100mL pressure vessels made of TFM (tetrafluoromethoxy) (PL100). The maximum
operating temperature, pressure and sample weight were 230°C (446°F), 40bar (580psi) and 500mg (0.5g)
respectively. The minimum fill volume of acid was 7mL.
All the measurements were conducted using single quadruple ICP-MS (Agilent 7700S Series ICP-MS, Agilent Technologies, Singapore). The instrument equipped with a micro-mist glass nebulizer, a cyclonic glass spray chamber and nickel skimmer cone for x-lens. Standard, blank and sample solutions were delivered using an Agilent I-AS auto sampler. A hexapole collision cell (CC) was used for As and Cd determinations. Internal standards (Ge and In) were added in-line to compensate for any effects from acids or instrument drift (non-spectral interference effects).The isobaric interferences were corrected by using correction formulas, which are included in the software of the ICP-MS instrument (Mass Hunter software - full version A 01.02.). The instrument software allowed the rapid switch between standard mode (no gas, cell vented to mass analyzer chamber) to CC mode (Helium gas mode) while continuously aspirating the sample. The ICP-MS operational conditions are summarized in Table 1 [26].
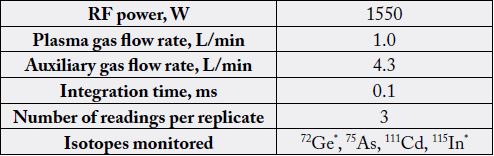
*Internal Standards
Mass resolution, mass calibration, sensitivity and stability of the system was checked daily by using a multi-element tuning solution of 1μg/L (1 ppb) of Ce, Co, Li, Mg, Tl and Y. According to the instrument manufacturer sensitivity and mass calibration was monitoring using analytical lines of Li - Lithium-7, Ac - actinium -89 and Tl - Thallium - 205; doubly charged ratio (70Ce2+/140Ce) (≤ 2.5%) and oxide ratio (156CeOcesium oxide/140Ce) (≤ 3.0%) were adjusted to low values. Helium mode was used for determination of concentrations of elements in the solutions. Selected analytical mass lines for the analytes to be analyzed in rice were 75 for arsenic and 111 for cadmium [26].
Calculation of the concentration is generally done automatically by the software of the ICP-MS instrument. The content W, as mass fraction, of the element was calculated in mg/kg as followed:

Where, a is the content (μg/L) of the element in the test solution, V is the volume (mL) of the digestion solution after being made up to volume, F is the dilution factor of the test solution and m is the mass of the test portion (g).
Sample preparation procedure is a critical point for the success of the analysis [13], being considered an
important source of error in method development. In the present study microwave assisted-acid digestion
sample preparation method was investigated under two different digestion conditions (two steps and single
step) in order to check their suitability for rice decomposition aiming at determining the arsenic and
cadmium concentrations by means of ICP-MS.
Eleven organic rice samples (1kg for each) were randomly selected to this study. Those rice samples (5 red raw rice and 6 white raw rice) were bought from several market places located in Homagama city, Colombo district, Sri Lanka and assuming that the production has avoided the use of synthetic fertilizers and pesticides. Results obtained for them were used to validate the method. Seventy one rice samples (42 red raw rice, 27 white raw rice and 2 white parboiled rice) received from different areas in Sri Lanka were used to method application.
At first, the samples were grinded in an analytical mill (National, Singapore); weighed using analytical balance (Shimadzu, Kyota, Japan).
For the acid digestion assisted by microwave radiation, the method given by manufacturer was performed
with some modifications. In this study, finely homogenized powdered of white and red/brown rice samples
(0.5g of each) were weighed and transferred to the dry, clean TFM digestion vessels (PL 100) specific for
the microwave oven used. Before digestion, each sample (11 organic samples) was spiked in order to reach a
final concentration of 25μg/L of each arsenic and cadmium using multi-element standard solution (within
the calibration curve concentration range) in the final solution (volume completed to 100.0mL by adding
deionized water). Nine millilitres of acid mixture (5 HNO3:1 H2O2) was added to each vessel and kept for
approximately 10 - 15 minutes to react prior to close the lid. The vessels was closed and placed in the rotor and
tightened. The loaded rotor was placed in microwave oven. Two different digestion programmes (two steps
and one step respectively) were independently run for 11 samples as shown in Table 2. After completion of
the digestion and cooling for 30 minutes, the vessel was opened carefully. The digested solution was filtered
and transferred into 100mL volumetric flasks and filled with deionized water up to the mark. The nonspiked
samples, same standards solution which was used to spike and blank solution (acid mixture) were
digested under the same conditions for each digestion programme. Recovery was calculated for each sample.
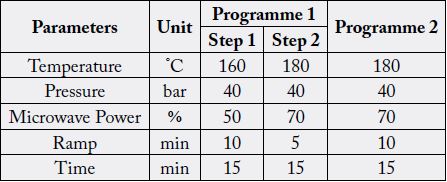
For the method validation, the sample solution obtained from digestion programme 4 (Table 2) in microwave
oven was selected due to the lesser time and temperature consumption. The analytical method validation was
performed by considering the limit of detection (LOD), limit of quantification (LOQ), linearity, precision
(repeatability). For all of the calculations, Eurachem [27] requirements were considered.
LODs and LOQs were established as three and ten times, respectively, the standard deviation of eight independently digested rice samples (used same rice type which contained lowest arsenic and cadmium content, for all eight analysis). The digested solution was filtered and transferred into 100mL volumetric flasks and filled with deionized water up to the mark. The concentrations were determined using ICP-MS.
Linearity was established separately by preparing the calibration curves of arsenic and cadmium by employing unweighted least-squares liner regression.
Repeatability of the method was evaluated by analysis eight replicates of lowest arsenic and cadmium contained rice sample (same sample used for estimate LODs and LOQs). The repeatability was calculated as relative standard deviation (RSD%).
The amount of matrix present in the test solution to be analyzed may create more or less significant matrix effect compared to pure multi-element standards [26]. Standard addition curves obtained from a rice sample spiked at different concentration levels from 1.0 to 50.0μg/L were compared with external calibration curves established from multi-element standards in order to evaluate the matrix effect, according to the method described in AOAC 2013.16 2016, [26,28].
To evaluate the analytical method performance for determining the arsenic and cadmium in different rice
types consumed by the Sri Lankan population, seventy one rice samples (42 red raw, 27 white raw 2 parboiled
white rice samples) from various cities of the country.
Expanded uncertainty estimation (Uc) for the obtained results was calculated according to the criteria
described in Eurachem/CITAC [29]. For this evaluation, the following parameters were considered: the
overall run to run variation (precision) of the analytical procedure using duplicate test and recovery study
using spiked samples of various types of rice. All balances and important volumetric measuring devices are
under regular control. Precision and recovery studies take into account the influence of the calibration of
the different volumetric measuring devices used during the investigation. Linearity of the response to the
relevant trace element (As or Cd) within the given concentration range is established during the validation
studies [29].
Expanded uncertainty was determined by multiplying the coverage factor (k) and the combined uncertainty, u (W): U(W) = k x u(W), considering the covering factor k = 2, for a confidence level of 95.45%.
Results and Discussion
The well-known polyatomic interference caused by 40Ar35Cl+ was considered in the arsenic determination by
using arithmetic correction given in the software in 7700 series Agilent ICP-MS [26]. According to t-test
(p = 0.005, n=4) no statistically significant differences between corrected and uncorrected concentration
were found. Similar result was found by Mataveil and co-workers [30] for rice flour certified reference
material digested with HNO3 and H2O2, reagents also used in the present study. This result can be explained
by the fact that only 2% of the total chlorine contents in rice plants are present in the edible part [31].
Table 3 shows the analytes recoveries in the spiked samples submitted to two different microwave digestion programmes for determining arsenic and cadmium in rice. It shows that recoveries depend on the rice type (red raw or white raw) as well as digestion programme. Mean recoveries varies from 83.5 to 114.2% in digestion programme 2, for both types of rice, indicating that the results for both element determined in the sample submitted to the microwave digestion using programme 2 were within the percentage recommended by FDA [32], which comprise the range between 80 and 120%.
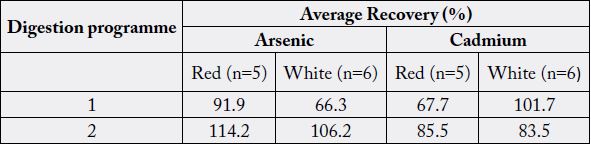
This finding highlights the possibility of using one step digestion programme containing lesser digestion time, temperature and better recovery. It is an advantage in arsenic determination whose volatility is well known.
Mataveil and co-workers [30] also investigated to the suitability of microwave assisted acid digestion method as a sample preparation method for arsenic, cadmium and lead determination in Brazilian rice. Recoveries ranged from 92.8 to 110.2% and these results are comparable to those found on this investigation. The results found in the present study are in agreement with the data reported by Wei et al [33], where acid digestion assisted by microwave radiation was carried out, reaching recoveries of 97.0, 106.0 and 103.0% for arsenic, cadmium and lead respectively.
The overall performance of the proposed method for arsenic and cadmium determination in rice is
summarized in Table 4.
LODs and LOQs results were considered acceptable as the values were below the established by Code Alimentarious [15,16,30] for arsenic and cadmium for rice and its derivatives: 0.30mg/kg and 0.40mg/kg respectively.
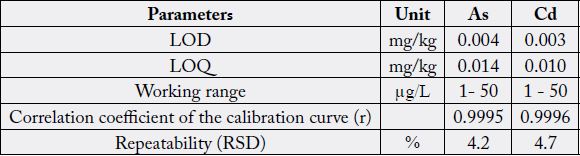
The linearity of the calibration curve was evaluated by investigation the correlation coefficient (r) of the calibration curve. The r values were higher than the 0.998 [27] for both of the analytes, as shown in Table 4, and the regression analyses showed that the linear correlation between concentration and ratio of instrument responses (cps for calibration standard/cps for internal standard) was significant (p < 0.05).
For both elements, the relative standard deviation, RSD% (repeatability) was compliance with European Commission Decision 2002 [34]. It did not exceed 10.0% as shown in Table 4.
Results were obtained in evaluation of matrix effect are summarized in Table 5.
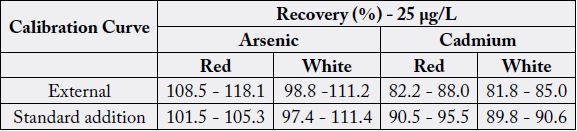
As shown in the Table 5, no matrix effect was observed and therefore aqueous standards were used for calibration [26,28].
Therefore, as expected, the use of microwave oven for rice acid digestion was appropriate for determination of the arsenic and cadmium concentration in rice using ICP-MS.
The above method was applied for quantifying the concentration of arsenic and cadmium in 71 rice samples
(42 red raw, 27 white raw and 2 white parboiled) consumes in Sri Lanka. Results are summarized in Table 6.
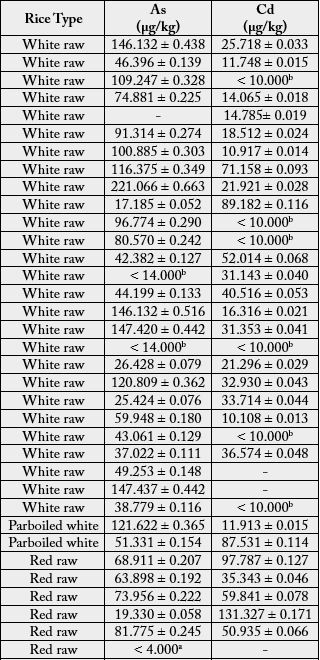
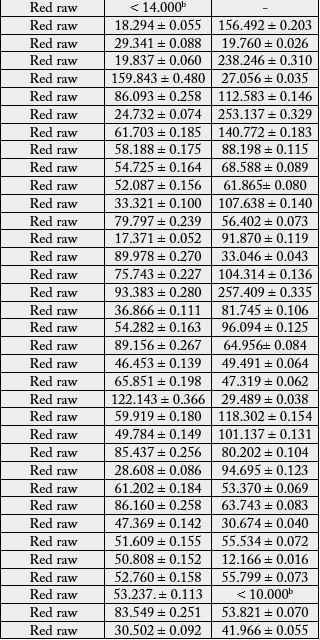
a: LOD; b: LOQ; * U(c): expanded uncertainty, coverage factor k = 2, for a confidence level of 95.45%
According to Table 6, out of 71 analyzed samples, 67 showed arsenic concentration higher than the LOQ, ranging from 17.185 to 221.066μg/kg (0.017 to 0.221mg/kg)
In one red raw rice sample, arsenic concentration was lower than the LOD. In three samples (one red raw rice and two white raw rice), arsenic concentration was lower than the LOQ and higher than LOD. The average arsenic concentration of parboiled rice was higher than that found in other rice types (86.476μg/kg), followed by white raw rice (77.014μg/kg) and red raw rice, which had the lowest arsenic concentration (57.407μg/kg). In the process of rice parboiling, the paddy is soaked in ambient water for some time, it has a potential to contamination of paddy by trace elements and other contaminants during the soaking, if clean water is not used [5].
In one white raw rice sample, arsenic concentration was 221.066μg/kg (0.221mg/kg). This value also lower than the maximum value established by the CODEX Alimentarius [15], which is 300μg/kg (0.30mg/ kg). The samples (red raw rice, white raw rice and parboiled rice) were considered satisfactory for human consumption with respect to international limits for arsenic in rice established by the CODEX Alimentarius [15], but in Sri Lanka, there is no maximum limit for arsenic in rice.
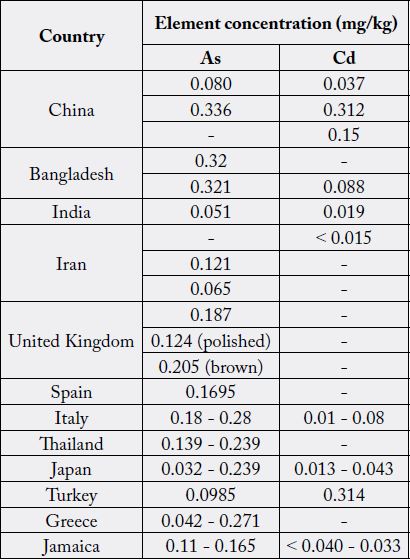
The arsenic concentrations found in the present study were in agreement with those previously, reported for rice in other countries investigations, as shown in Table 7 [30], and also comparable to others in investigation performed in Sri Lanka [5].
With respect to cadmium, concentrations of cadmium of all samples were above the LOD; only seven below the LOQ and all other were above the LOQ. According to the Table 6, Cadmium concentrations higher than LOQ were lies in between 10.108 and 257.409μg/kg (0.010 and 0.257mg/kg). In none of the analyzed samples, cadmium concentrations exceeded the maximum value of 400μg/kg (0.40mg/kg) allowed by the CODEX Alimentarius [16]. Thus referring cadmium contamination, the red raw rice, white raw rice and parboiled rice were considered as satisfactory for human consumption.
In the view of results of present study, an elevated level of cadmium was found in red raw rice samples (average value 79.276μg/kg), whilst the lower level of cadmium is found in both white raw rice (average value 23. 292μg/kg) and parboiled rice (average value 49.722μg/kg).
The average concentrations of cadmium found in the present study were in agreement with those cited in the literature; and they pointed out the evident of occurrence of the highest cadmium concentration in red raw rice than white rice [30,35].
Cadmium concentrations found in the analyzed samples were similar to those reported in other studies carried out in other countries, as outlined in Table 7 [20].
Overall variation of arsenic and cadmium levels observed in different rice samples from Sri Lanka as well as from other countries can generally be attributed to various factors such as varietal differences, soil composition, geographical location, environmental factors, agricultural chemicals, post-harvest processing water quality, growing conditions and quality of trace element analysis [5,30].
Conclusions
Today, industrialization and development occurs without caring the environment and have led to heavy metal contamination of human food. Dietary intake is the main route of exposure to trace elements such as As and Cd for most of people and have drawn a lot of attention. The microwave assisted acid digestion sample preparation method applied here is found to a convenient, rapid, reproducible, minimum amount of acid used and shorter time required sample preparation method (Mean recoveries varies from 83.5 to 114.2% for both elements). The parameters obtained for validation have demonstrated that the method fits for its purpose, which is to quantify the arsenic and cadmium in rice samples by ICP-MS. This information is important for laboratories that execute rice analysis. Regarding the red raw, white raw and parboiled rice samples analyzed, the concentrations are found for arsenic ranging from 17.185 to 221.066μg/kg (0.017 to 0.221mg/kg) and for cadmium ranging from 10.108 and 257.409μg/kg (0.010 and 0.257mg/kg) were lower than the established limits (0.30mg/kg for arsenic and 0.40mg/kg for cadmium in rice) according to Codex Alimentarious. It appears that rice samples from Sri Lanka were considered satisfactory for human consumption regarding the investigated elements.
In Sri Lankan point of view, there are no maximum limits for trace elements in rice. It is better to established limits with considering geological factors, rainfall pattern, types of chemical use, pattern of chemical usage etc. Also, results of this study can be used as baseline values for future comparisons.
Conflicts of Interests
There is no conflict of interests.
Bibliography


Hi!
We're here to answer your questions!
Send us a message via Whatsapp, and we'll reply the moment we're available!