Biography
Interests
Emmanuel Ilesanmi Adeyeye1*, Abdul Ademola Olaleye2 & Adeolu Jonathan Adesina3
1Chemistry Department (Analytical Unit), Ekiti State University, Ado-Ekiti, Nigeria
2Chemistry Department, Federal University Dutse, Jigawa State, Nigeria
3Chemistry Department (Analytical Unit), Ekiti State University, Ado-Ekiti, Nigeria
*Correspondence to: Dr. Emmanuel Ilesanmi Adeyeye, Chemistry Department (Analytical Unit), Ekiti State University, Ado-Ekiti, Nigeria.
Copyright © 2018 Dr. Emmanuel Ilesanmi Adeyeye, et al. This is an open access article distributed under the Creative Commons Attribution License, which permits unrestricted use, distribution, and reproduction in any medium, provided the original work is properly cited.
Abstract
The amino acid (AA) composition of the eyes and brain of domestic duck (Anas platyryncos) were reported using standard analytical techniques. Among the amino acids investigated, glutamic acid was most abundant in both samples with values ranging between 12.50-15.60g/100g crude protein (CP). The most concentrated essential amino acid (EAA) was leucine (7.68-8.04g/100g CP) whereas cystine was least concentrated with 0.860g/100g CP in each of the samples. The total acidic amino acids in the samples (21.7-23.7g/100g CP) were greater than the total basic amino acids (14.5-16.2g/100g CP). The Leucine/Isoleucine (Leu/Ile) ratio (1.95-2.85) showed that Leu > Ile in both samples. The predicted protein efficiency ratio (P-PER1 and P-PER2) were 2.25-2.37 and 2.24-2.31, respectively. The isoelectric point (pI) ranged between 4.97-5.26. Based on the whole hen’s egg, histidine (His) (1.12-1.18), glutamic acid (Glu) (1.16-1.19), proline (Pro) (1.01-1.17) and glycine (Gly) (1.86-2.32) had higher amino acid scores which was greater than 100% in both samples while cystine (Cys) (0.478) was limiting in the brain and isoleucine (0.427) had the least score in the eyes. On provisional amino acid scoring pattern, the limiting amino acid was isoleucine with values recorded as 0.90 (brain) and 0.598 (eyes). Essential amino acid scores based on pattern for pre-school child (2-5 years) showed that the samples would supply the required EAAs for this category. Generally, correlation analysis showed that significant differences existed between the samples in all the parameters determined at α = 0.05 critical level.
Abbreviations
AA: Amino Acid, EAA: Essential Amino Acid, EAAI: Essential Amino Acid Index, BV: Biological Value, pI: Isoelectric Point, P-PER: Predicted Protein Efficiency Ratio, TEAA: Total Essential Amino Acid, TNEAA: Total Non-essential Amino Acid, TEArAA: Total Essential Aromatic Amino Acid, TEAlAA: Total Essential Aliphatic Amino Acid A.O.A.C.: Association of Official Analytical Chemists, SD: Standard Deviation, CV%: Coefficient of Variation Percent, CA: Coefficient of Alienation, IFE: Index of Forecasting Efficiency, FAO: Food and Agriculture Organization, WHO: World Health Organization, UNU: United Nations University.
Introduction
Duck is a waterfowl that is mostly found in fresh water. One species of freshwater duck is the mallard (Anas
platyrhyncos) which has been a common domesticated livestock bird in many cultures. Its domestication
started over 2000 years ago in China and this was being practiced in classical Rome and has been pursued
with enthusiasm in many parts of the world. The meat obtained from matured duck refers to duck meat but
the meat coming from juvenile duck is usually called duckling [1]. Duck meat is used in a variety of dishes
around the world. Although, it is very popular in many parts of the world such as China and Asian countries,
duck meat has not gained popularity in Nigeria as compared to chicken and turkey, and they are hardly
found in supermarkets except when they are specially ordered for. In Nigeria, duck population has been put
at 1.21 million as against 133.5 million local/exotic chicken [1]. This could be due to the inadequate duck
farmers for optimum production, limitation in the development of duck meat products, little encouragement
of duck meat for human consumption and most importantly, the little attention paid to duck production by
researchers when compared to other poultry species. Despite abundant water, pastureland and the fact that
10 % of Nigerian households keep ducks [2], consumption of its meat and eggs was low. In fact, a survey [1]
revealed that ducks were neither raised for egg production nor consumption. Thus ducks were seldom eaten
or sold. The reason obtained by the survey, basically on taboo, partially explains why ducks have not found
favour with consumers. In order to further promote the consumption of duck meat in Nigeria and give it a
global recognition, the nutritional composition such as the amino acid profile is essentially necessary.
It is worthy to note that the quality of protein in processed foods is commonly determined by their amino acid composition [3]. Also, Kim et al. [4] reported that high amino acid content as well as essential amino acids are found in protein foods. Differences in the types and percentages of essential amino acids in foods could influence the value of protein consumed [5]. There is scarce information on the amino acid profile of the domestic duck visceral organs. The present study is therefore aimed at investigating the amino acid contents of two major parts of duck meat (eyes and brain). This is to further provide a comprehensive data on duck meat amino acids and also promote the use of duck meat especially the eyes and brain as alternative sources of protein for both consumers and the food industry. Eyes and brain are delicacy protein sources for Nigerian children.
Materials and Methods
Matured domestic duck (Anas platyrhncos) was obtained from a local farm at Aba Erinfun in Ado-Ekiti,
Ekiti State of Nigeria. The head was held on the stump and removed with an axe. After bleeding, the duck
feathers were plucked manually after treatment with hot water. After plucking, the head was rinsed with
distilled water. The eyes were carefully removed from the head and the skull was carefully opened to remove
the brain. The two samples (eyes and brain) were carefully dried in an oven at 80oC for 2 hours. The samples
were dry milled separately to fine powder using an Exeller mixer grinder (Marlex®) and stored in a dry, cool
place pending analyses.
The micro-Kjeldahl method as described by Pearson [6] was followed to determine the fat-free crude protein.
The fat was extracted with a chloroform/methanol (2:1 v/v) mixture using Soxhlet extraction apparatus [7].
Between 30mg and 35mg defatted samples were weighed into glass ampoule, 7ml of 6M HCl was added
and hydrolysed in an oven preset at 105 ± 5°C for 22 hours. Oxygen was expelled in the ampoule by passing
nitrogen into it. Amino acid analysis was done by ion-exchange chromatography [8] using a Technicon
Sequential Multisample Amino Acid Analyzer (Technicon Instruments Corporation, New York, USA). The
period of analysis was 76 minutes, with a gas flow rate of 0.50ml/min at 60°C, and reproducibility was ±
3%. Tryptophan was not determined because of cost.
Predicted Protein Efficiency Ratio (P-PER)
The predicted protein efficiency ratio (P-PER) was calculated using one of the equations derived by Alsmeyer
et al. [9], i.e.
P-PER1 = -0.468 + 0.454 (Leu) - 0.105 (Tyr)
P-PER2 = -0.684 + 0.456 (Leu) - 0.047 (Pro)
Isoelectric Point
The isoelectric point (pI) was calculated using the equation below:
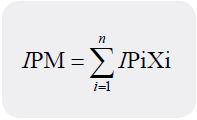
Where: IP is the isoelectric point of the ith amino acid in the mixture and Xi is the mass or mole fraction of the ith amino acid in the mixture [11].
Amino Acid Scores
Determination of the amino acid scores was first based on whole hen’s egg amino acid profile [12]. In this
method, both essential and nonessential amino acids were scored. Secondly, amino acid score was calculated
using the following formula:
Amino acid score = [amount of amino acid per test protein (mg/g)] / [amount of amino acid per protein in reference pattern (mg/g)] [13].
In the calculation based on amino acid scoring pattern, Met + Cys and Phe + Tyr were each taken as a unit. Also, only essential amino acids determined were scored. Amino acid score was also calculated based on the composition of the amino acids obtained in the samples compared with the suggested pattern of requirements for pre-school children (2-5 years). Here, Met + Cys and Phe + Tyr were each taken as a unit. Also, only essential amino acids including His were scored [14].
Essential Amino Acid Index and Biological Value
The essential amino acid index (EAAI) and biological value (BV) were calculated by the method of Oser
[15].
BV = 1.09 (EAAI) – 11.73
Other determinations such as total amino acid (TAA), total essential amino acid (TEAA), total nonessential
amino acid (TNEAA), total acidic amino acid (TAAA), total basic amino acid (TBAA), total
essential aliphatic amino acid (TEAlAA), e.t.c. and their percentages were made. Total sulphur amino acid
(TSAA), percentage cystine in TSAA (% Cys in TSAA) and Leu/Ile were also calculated.
Statistical analysis [17,18] was carried out to determine mean, standard deviation (SD), coefficient of
variation percent (CV%). Also calculated were linear correlation coefficient (rxy), coefficient of determination
or variance (rxy2), linear regression coefficient (Rxy), coefficient of alienation (CA) and index of forecasting
efficiency (IFE). The rxy was subjected to the table (critical) value at r = 0.05 to see if significant differences
existed in the values of the amino acids between the two samples and other parameters calculated from the
amino acid data.
Results
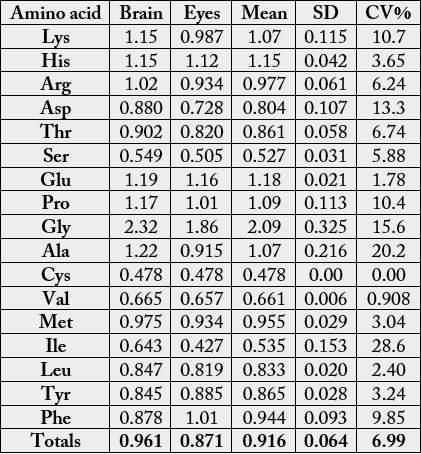
The amino acids composition of Anas platyrhncos eyes and brain (dry weight) is shown in Table 1. Among
the amino acids, Glu had the highest concentration in both samples with the values 14.3g/100g (brain)
and 13.9g/100g (eye); whereas, cystine recorded the lowest concentration with 0.860g/100g in each of the
samples. Among the essential amino acids (EAAs), lysine (7.14g/100g cp) had the highest concentration
in brain, but in eye, it was leucine (6.80g/100g cp). Other EAAs of high concentrations were (g/100g cp):
phenylalanine (Phe): 4.48 (brain) and 5.15 (eye); arginine (Arg): 6.21 (brain) and 5.70 (eye); threonine
(Thr): 4.60 (brain) and 4.18 (eye); valine (Val): 4.99 (brain) and 4.93 (eye). The concentration of methionine
(Met) ranged between 2.99-3.12 g/100g cp. Histidine (His) concentrations in the samples were 2.82g/100g
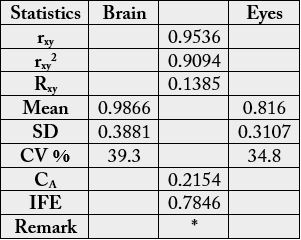
cp (brain) and 2.69g/100g cp (eye). In Table 2, the statistical analysis showed the following results: 0.9777,
-0.0672. 0.2099 and 0.7901 for correlation coefficient, regression, coefficient of alienation and index of
forecasting efficiency respectively.
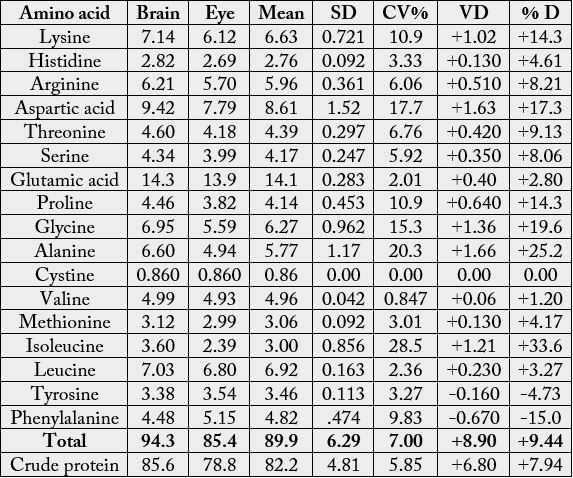
VD = value difference, %D = percentage difference
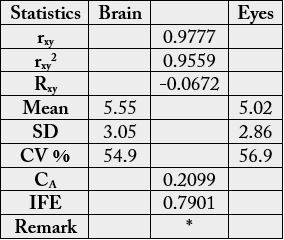
rxy = correlation coefficient; Rxy = regression coefficient; CA = coefficient of alienation; IFE = index of forecasting efficiency; * = results significantly different at n-2 = 17-2 =15 and r = 0.05 (critical value = 0.482).
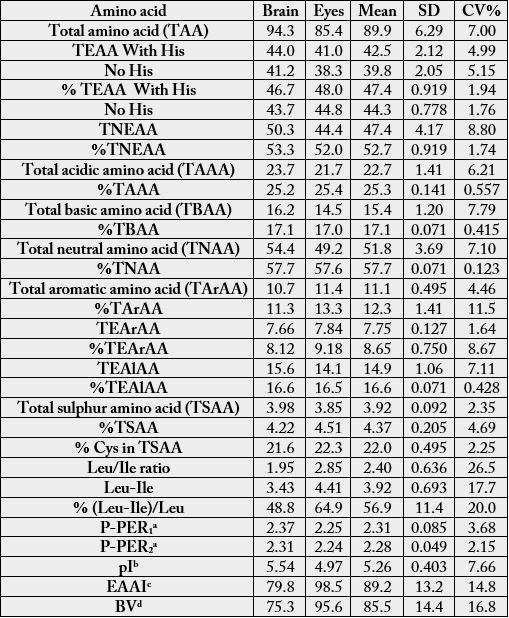
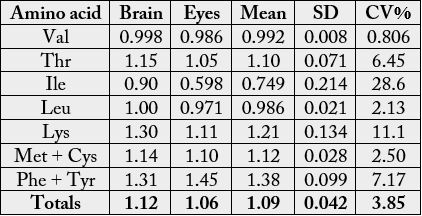
Table 3 presents the concentrations of total amino acid (TAA), total essential amino acid (TEAA), total non-essential amino acid (TNEAA), total acidic amino acid (TAAA), total basic amino acid (TBAA), total neutral amino acid (TNAA), total essential aliphatic amino acid (TEAlAA) and their percentage values. Some other determinations such as predicted protein efficiency ratio 1 and 2 (P-PER1 and P-PER2), Leu/Ile ratios, isoelectric point (pI), essential amino acid index (EAAI) and biological value (BV) are also contained in Table 3. The TAA values of the present study were 94.3g/100g cp (brain) and 85.4g/100g cp (eye). The TEAA values (g/100g cp) in this study fell within 41.0-44.0 (with His); 38.3-41.2 (no His). The total essential aromatic amino acid (TEArAA) in the samples were 7.66 (8.12 %) (brain) and 7.84 (9.18 %) (eye). The percentage Cys/TSAA in this study ranged between 21.6-22.3 %. The predicted protein efficiency ratios were P-PER1 (2.25-2.37) and P-PER2 (2.24-2.31). The EAAI of the samples were 79.8-98.5 and their corresponding BV were 75.3-95.6.
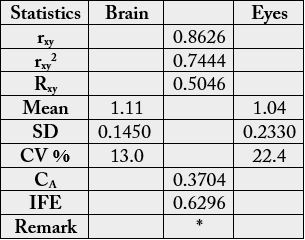
In the amino acid scores based on whole hen’s amino acid (Table 4), His, Glu, Pro and Gly had scores greater than 1.00 in each sample: His (1.12-1.18), Glu (1.16-1.19), Pro (1.01-1.17) and Gly (1.86-2.32). Lys (1.15), Arg (1.02), Ala (1.22) also had scores greater than 1.00 in the brain whereas Phe (1.01) had value greater than the whole hen’s egg value. Cys and Ile had the lowest scores in the brain and eye with the values 0.478 and 0.427 respectively. In Table 5, the statistical analysis showed the following results: 0.9536, 0.1385. 0.2154 and 0.7846 for correlation coefficient, regression, coefficient of alienation and index of forecasting efficiency respectively. Table 6 presents the EAA scores based on provisional essential amino acid scoring pattern [13]. The following amino acids had scores greater than 1.00 in aech sample: Thr (1.05-1.15), Lys (1.11-1.30), Met + Cys (1.10 -1.14) and Phe + Tyr (1.31-1.45). Leu had scores >1.00 in the brain. The least EAA scores in both samples was Ile: 0.90 (brain) and 0.598 (eye). In Table 7, the statistical analysis showed the following results: 0.8626, 0.5046. 0.3704 and 0.6296 for correlation coefficient, regression, coefficient of alienation and index of forecasting efficiency respectively.
* = = results significantly different at n-2 (n-2= 18-2 =16) and r = 0.05 (critical value = 0.468).
* = results significantly different at n-2 (n-2 = 8-2 = 6) and r = 0.05 (critical value = 0.707).
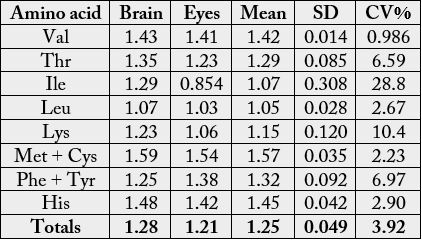
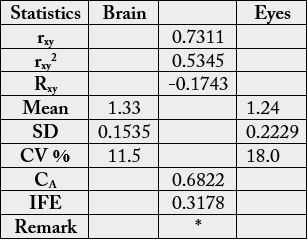
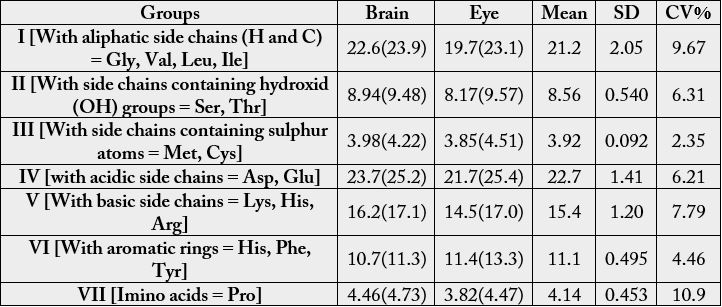
The essential amino acid scores on the suggested requirements for pre-school children (2-5 years) is depicted in Table 8. The values were (brain): 1.43 (Val), 1.35 (Thr), 1.29 (Ile), 1.07 (Leu), 1.23 (Lys), 1.59(Met + Cys), 1.25 (Phe + Tyr), 1.48 (His); (eye): 1.41, (valine), 1.23 (threonine), 0.854, (Ile), 1.03 (Leu), 1.06 (Lys), 1.54 (Met + Cys), 1.38 (Phe + Tyr), 1.42 (His). In Table 9, the statistical analysis showed the following results: 0.7311, -0.1743. 0.6822 and 0.3178 for correlation coefficient, regression, coefficient of alienation and index of forecasting efficiency respectively. The various amino acids were distributed into groups [16] in Table 10. The concentrations were as follows: value in g/100g cp (percentage): group I, 19.7-22.6 (22.6-23.1); group II, 8.17-8.94 (9.48-9.57), group III, 3.85-3.98 (4.22-4.51); group IV, 21.7-23.7 (25.2-25.4); group V, 14.5- 16.2 (17.0-17.1); group VI, 10.7-11.4 (11.3-13.3); group VII, 3.82-4.46 (4.47-4.73).
SD-standard deviation, CV- coefficient of variation
* = results significantly different at n-2 (n-2 = 9-2 = 7) and r = 0.05 (critical value = 0.666).
Discussion
The high levels of glutamic acid in this study were not unexpected. The values compared well with the
following literature values for animal proteins: three fresh water fish samples (14.3-14.6g/100g [19]; whole
organism, flesh and shell of Pandalus borealis (10.3-14.8g/100g cp) [20]; yolk and albumen of chicken egg
(14.1-14.5 g/100g cp) [21]. Glutamic acid had values of 14.0g/100g cp and 14.2g/100g cp in the brain and
eye of guinea fowl (Numida meleagris) hen respectively [22]. In the brain and eyes of African giant pouch
rat (Cricetomys gambianus), glutamic acid value was 12.1g/100g cp in the brain and 13.0g/100g cp in the
eyes; Glu being the most concentrated amino acid [23]. Glutamic acid had been reported to be the most
concentrated amino acid in soyabean, rice and egg protein [24], Callinectes latimanus [25], whole body, flesh
and exoskeleton of common West African fresh water male crab [26], Sesasum indicum [27].
Valine daily requirement is 23mg/kg and its deficiency leads to locomotor dysfunction in young rat [28]. The presence of substantial amount of arginine in diets enhances Ca2+ absorption, but under most physiological circumstances, this is of little consequence [29]. Met contains sulphur in the thioether linkage. Met is needed for the synthesis of other important substances, including choline. Adeyeye [28] reported that administration of Met prevents the fatty liver and causes resumption of growth. Children do not grow if His is absent from their diet, but adults can probably synthesise enough for their daily needs. His is a precursor of histamine, a substance normally present in small amounts in cells [19]. The standards of FAO/ WHO/UNU [14] for pre-school children (2-5 years) are (g/100g cp): Leu (6.6), Ile (2.8), Lys (5.8), Met + Cys (2.5) and His (1.9). Hence, the samples would be able to provide the required or even more than the required Leu, Ile, Met + Cys and His. Generally, comparison of results among the samples showed low variation as it was evident in the levels of coefficient of variation percent (CV %) (0.00-28.5). The value differences in amino acid profiles between the two samples and their percentage differences showed that out of nineteen parameters determined, sixteen 14/17 (82.4%) were more concentrated in the brain than the eye; two 2/17 (11.8%) were more concentrated in the eye than the brain whereas, one amino acid 1/17 (5.88%) recorded equal concentration in both samples. In the African giant pouch rat (C. gambianus) amino acid profiles showed that 7/18 (38.9%) of the parameters were more concentrated in the brain, 10/18 (55.6%) more in the eyes and 1/18 (5.56%) recorded equal concentration in both samples [23]. In quinea fowl (N. meleagris) the distribution was 8/18 (44.4%) in the brain and 10/18 (55.6%) in the eyes [22].
Statistical analysis of the results from Table 1 could be seen in Table 2. The correlation coefficient (rxy) was positively high and significant. The regression coefficient was low and negative. Both overall mean values were low in both samples at 5.55 g/100g (brain) and 5.02g/100g) cp (eye) with correspondingly relative high coefficient of variation (CV %) of 54.9 and 56.9. The coefficient of alienation (CA) or non-relationship was low at 21.0%) but high index of forecasting efficiency (IFE) of 79.0%. The IFE is a reduction in the error of prediction of relationship, here between the amino acids of the brain and eye of the sample. The error of prediction of relationship in this sample here would be 100 - 79.0 = 21% meaning it would be easy to predict the biochemical relationship in the brain and eye of the sample. The IFE result gave an indication that the biochemical functions of the brain could also be performed by the eye and vice versa.
The essential amino acid requirements according to FAO/WHO/UNU [14] are (g/100g, with His): infant (46.0), pre-school (2-5 years) (33.9), school child (10-12 years) (24.1) and adult (12.7); (without His): infant (43.4), pre-school (32.0), school child (22.2) and adult (11.1). FAO/WHO/UNU [14] also revealed the TEAA as (g/100g cp, with His): egg (51.2), cow’s milk (50.4) and beef (47.9); (without His): egg (49.0), cow’s milk (47.7) and beef (44.5). The values of TEAA in this study were however higher than those from the following plant sources: Vigna subterranea seed parts (22.5-80.6g/100g cp) [30], Phoenix dactylifera fruits (29.7g/100g cp) [31]. The percentage ratio of total essential amino acid to the total amino acid in the samples (46.7-48.0) were close to that of egg (50%) [32] and well above the 39% considered adequate by FAO/WHO/UNU [14] for ideal protein food for infants, 26% for children and 11 % for adults. The TEAA/TAA percentages in this study also compared well with the following animal protein sources: 45.1% (liver), 47.8% (heart), 49.8% (egg) of Anas platyrhynchos consumed in Nigeria [33]; 45.9-47.1% in meat organs of turkey-hen [34]; 46.2% in Zonocerus variegatus [35]; 48.1-49.5% in brain and eyes of African giant pouch rat [23]. In the guinea fowl, the values were 47.5 (brain)-52.2 (eyes) [22]. The %TNAA in the samples ranged between 57.6-57.7. This indicates that the neutral amino acids formed the bulk of the amino acids. The total sulphur amino acid (TSAA) of the samples (3.85-3.98g/100g cp) were lower than 5.8g/100g cp recommended for infant [14]. The range of aromatic amino acid suggested for ideal protein is 68-118 mg/g cp [14]. It means the Anas platyryncos samples could be good supplements of cereal flours. The values of Cys/TSAA were lower than those reported for the following animal protein: Zonocerus variegatus (25.6 %), Macrotermes bellicosus (36.3 %) and Sudananautes africanus africanus (27.3-32.8 %) [36]. It has been observed that most vegetable proteins contain more Cys than Met: Phoenix dactylifera fruit (56.1 %) [31]; coconut endosperm (62.9 %) [37]. The concentration of Leu/Ile ratio in the brain was 1.95. This showed that consumers might not experience health risks associated with Leu/Ile ratio when consumed as protein source as it was lower than the required 2.36 [38]. Leu/Ile ratio in the eye (2.85) was however slightly higher. Leu/ Ile imbalance from excess leucine might be a risk factor in the development of pellagra particularly in maize eaters [39]. Clinical, biochemical and pathological observations in experiments conducted in humans and laboratory animals showed that high Leu in the diets impairs the metabolism of niacin and tryptophan and is responsible for the niacin deficiency in sorghum eaters [40]. Belavady et al. [41] indicated that animals fed sorghum proteins with less than 11g/100g cp Leu did not suffer from nicotinic acid deficiency. The concentrations of Leu (6.80-7.03g/100g cp) in the present report would therefore prevent pellagra.
The P-PER values vary between 0.000 for a very poor protein food and a maximum possible of just above 4.00 for good protein food. In general, the better the protein, the lower the level the diet required to produce the highest protein efficiency ratio. This is a clear reflection of the importance of the proper nutritive balance of all the amino acids to produce optimum metabolic efficiency [20].
The pI in this study ranged between 4.97-5.54, showing that the samples were in the acidic medium of the pH range. The calculation of pI from AA will assist in the quick production of certain isolate of organic products without going through the protein solubility determination to get to the pI.
The levels of EAAI and BV revealed to a reasonable extent the quality of protein in the samples. EAAI is useful in evaluating food formulation for protein quality, although, it does not account for difference in protein quality due to processing methods or certain chemical reactions [42]. BV is a scale of measurement used to determine what percentage of a given nutrient source is utilized by the body. It shows how well and quickly our body can actually use the proteins we consume. Biological value varies greatly depending on age, weight, health, sex, current metabolism, etc of the organism. No matter the condition of individual or diets, a protein source with biological value such as egg will be more easily utilized than that with low biological value [43]. Both EAAI and BV values were generally high in this report. The values of EAAI in this report were much higher than the value of 67 in shellfish, shrimp, including prawns, raw or canned and the value of 98.5 (95.6) being correspondingly very close to the values in the egg [15].
In the amino acid scores based on whole hen’s amino acid (Table 4), His, Glu, Pro and Gly had scores greater than 1.00 in each sample: Lys, Arg and Ala also had scores greater than 1.00 in the brain whereas Phe had value greater than the whole hen’s egg value. Cys and Ile had the lowest scores in the brain and eye respectively.
The statistical analysis of the results shown in Table 4 could be seen in Table 5. The rxy was high, positive and significant. The Rxy was positive but low. The mean, standard deviation (SD) and CV % were low for both samples. Whereas the CA was low (0.2154 or 21.5 %), the IFE was high (0.7846 or 78.5%) thereby making the prediction of relationship easy.
In the EAA scores based on provisional essential amino acid scoring pattern [13] (Table 6), the following amino acids had scores greater than 1.00 in aech sample: Thr, Lys, Met + Cys and Phe + Tyr. Leu had scores >1.00 in the brain. The least EAA scores in both samples was Ile and therefore, to correct for the limiting amino acid (LAA) of the samples if they serve as sole source of protein food, it will be 100/90.0 (or 1.11) × protein of the brain and 100/59.8 (or 1.67) × protein of the eye [44]. The statistical analysis of the results from Table 6 can be seen in Table 7. The rxy was positive, high and significant but lower than in Tables 2 and 5. Mean, SD and CV % were low but the CV % in eye almost doubled the CV % in brain. The value of CA was much lower than that of IFE, thereby making prediction of relationship in biochemical functions easy.
The levels of the essential amino acid scores on the suggested requirements for pre-school children (2-5 years) (Table 8) showed that the samples would supply virtually all the required EAAs for the pre-school children as most of the EAA scores were above 1.00 (i.e. 100%) except Ile in eye with value of 0.854. Therefore, to get all the amino acid requirements in full, the correction would be 100/85.4 (or 1.17) × protein of the eye. Generally, the EAAs most often acting in a limiting capacity are (a) Lys, (b) Met + Cys, (c) Thr, and (d) Trp [44].
Table 9 depicts the statistical analysis of the results from Table 8. The rxy was lowest among the Tables 1a, 3a and 4a, however, it is still high, positive and significant at r = 0.05. The Rxy was negative and low. The mean, SD and CV % as shown were lower than the previous values particularly as seen in Tables 3 and 4. The CA was high (0.6822) being highest compared to CA in 1a, 3a and 4a with corresponding low IFE (0.3178) thereby making the prediction of relationship in the biochemical functions difficult between the brain and the eye under this parameter. The reduction in the error of prediction (IFE) was low, hence the difficulty in the prediction of relationship.
In the various amino acids distribution into groups [16] in Table 10, in terms of concentration, group IV > group I > group V > group VI > group II > group III > group VII. The variations were low as the CV % values of 2.35-10.9 were recorded.
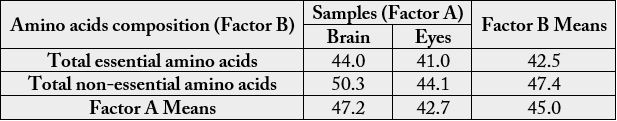
Table 11 summarizes the amino acids into two factors A and B. Factor A means represent the means of amino acid values of the samples along the vertical axis and factor B means are the means along the horizontal axis. The mean of factor A means gave the same value of 45.3 g/100g cp as in factor B means.
Conclusion
The results of the study showed that the samples investigated were rich in amino acids especially essential
amino acids and therefore could be a good source of high quality protein. The concentrations of Lysine,
Arginine, Aspartic acid, Glutamic acid and Leucine were high in the samples. The percentage essential
amino acids in the samples were comparable with the percentage of non-essential amino acids. The total
EAAs meet the FAO/WHO/UNU [14] standards for all categories of human beings: infant, pre-school,
school child and adult. Generally, the samples are good sources of amino acids and would be useful as food
supplements and in food fortification.
Bibliography


Hi!
We're here to answer your questions!
Send us a message via Whatsapp, and we'll reply the moment we're available!