Biography
Interests
Claudio Téllez Soto, A.1*, Liliane Pereira Pinto2, Lázaro Medeiros Neto, P.1, Claudio Téllez Zepeda, A.1, Michely Silva, G. P.1, Isamara Tanaka3 & Airton Martin, A.1
1Biomedical Engineering Innovation Center - Biomedical Vibrational Spectroscopy Group. Universidade Brasil -
UBr - Rua Carolina Fonseca, 235 - 08230-030 - Itaquera • São Paulo/SP, Brasil
2FEPI-Fundação de Ensino e Pesquisa de Itajubá, Centro Universitário de Itajubá. Av.Dr. Antônio Graga Filhoi,
687-Porto Velho, Itajubá-MG, 35501-002. Brasil
3Hospital São Francisco de Assis-Coordenadora da UTI pediátrica.- Rua Ernesto Duarte, 70 CEP 12311-200.
Parque Califórnia-Jacareí-SP. Brasil
*Correspondence to: Dr. Claudio Téllez Soto, A., Biomedical Engineering Innovation Center - Biomedical Vibrational Spectroscopy Group, Universidade Brasil - UBr. São Paulo, Brazil. Email: cayotellez@gmail.com
Copyright © 2022 Dr. Claudio Téllez Soto, A., et al. This is an open access article distributed under the Creative Commons Attribution License, which permits unrestricted use, distribution, and reproduction in any medium, provided the original work is properly cited.
Abstract
In this article we present several vibrational spectroscopic techniques used in the analysis of glycation products and water content in the dermis of diabetic elderly, healthy young, and healthy elderly women, as well as in different types of thyroid cancer, goiter and abnormal lymph nodes. The measurements of the different samples were made using confocal Raman spectroscopy and Fourier transform infrared spectroscopy. When necessary, vibrational assignments were performed by theoretical calculation of the spectra based on the Density Functional Theory (DFT). The spectroscopic techniques were: correction of the spectra baseline, vector normalization, smoothing, second spectral derivative, band deconvolution analysis, spectral subtraction, spectral inversion, analysis of the intensity of the fundamental bands, enhanced infrared absorbance’s and SERS effect.
Introduction
Over the past ten years, the research group of vibrational spectroscopy applied to biomedical engineering
at Universidade Brasil (São Paulo) published a series of scientific articles related to cancerous tissues [1-5].
We also published studies concerning glycation products present in the dermis of young, healthy elderly and
elderly women with diabetes [6-9], as well as the extension of these researches to the dermal water content
using the comparative analysis of proline bands and hydroxyproline in the spectral region between 1000 - 800
cm-1, and in the spectral region between 300-3600 cm-1 [10]. In the case of the confocal Raman spectroscopic
study of papillary and follicular thyroid cancer, as well as goiter, the vibrational assignment of the Amide
I bands was based on previous studies of the infrared spectra in relation to the protein composition of the
cancerous tissue. In a previous study on the analysis of bacteria by infrared spectroscopy [11], we presented
a spectra measurement technique that increases the absorbance by approximately 400%.
In the article [8], we employed RM1 semi-empirical and DFT: B3LYP/3-21G methods to achieve theoretical insights regarding the confocal Raman experimental observations in qualitative water content of the skin dermis of healthy young, healthy elderly and diabetic elderly women. It is well known that the water quantity in healthy human dermis increases with age. However, in the elderly diabetic group, the increased sugar content directly affects the proline and hydroxyproline bands as well as the dermal water content. In the present work, our first approach was to perform a theoretical model of these systems using the RM1 semi empirical method and, after the subsequent model was built using DFT/B3LYP:3-21G procedures considering the amino acids chain formed by hydroxyproline and proline alone, which interact with one and four water molecules, we analyzed the dipole moment and the polarizability variation in order to determine the hydrogen bonds in these systems.
In our paper “In vivo determination of dermal water content in chronological skin aging by confocal Raman spectroscopy” [10], the difference in the total water content between elderly diabetic women vs healthy young women, and for healthy elderly women vs healthy young women were of 2.7 and 1.6%, respectively. In order to analyze only bounded water (independent of the use of skin - tools) in the amino acids chain of collagen, we subtracted the Raman water spectrum from the mean Raman spectra for the three groups of participants.
In the publication “Combined in vivo confocal Raman spectroscopy and density functional theory to detect carboxymethyl(lysine) in the human stratum corneum” [6], the identification of CML in the set of experimental confocal Raman spectra of the skin of young, healthy elderly and diabetic elderly women was done by comparison with the confocal Raman spectrum of CML, with the calculated B3LYP/6-311G spectrum of CML, with the second derivative spectrum of the mean value of the confocal Raman spectra of the skin of the three groups of participants, and by comparing between the second derivative spectrum of the three groups of participants with the confocal Raman spectrum of CML. The differences between the three groups of spectra were analyzed through band deconvolution analysis (BDA) and through the corresponding Gaussian fitting according to the relative concentrations of the CML spectral coincidental bands for each group.
In the paper “Infrared and confocal Raman spectroscopy to differentiate changes in the protein secondary structure in normal and abnormal thyroid tissues” [1] the histological analysis of normal thyroid tissue, goiter, papillary carcinoma, and follicular carcinoma samples, conducted in a mean time of 3 to 5 days, showed an intrinsic variance among them. By confocal Raman spectroscopy, a set of 100 spectra for each tissue sample was acquired in a few minutes. It is evident that diagnosis of goiter and thyroid cancer by means of confocal Raman spectroscopy is significantly faster in comparison to conventional approaches.
We used the Gaussian fitting of the Amide I band in the four types of samples. The band positions inside the profile of the Amide I band was determined using the second derivative and the FSD spectra. In both the IR and confocal Raman spectra, percentages of the different components of the secondary proteins’ structure were found after three consecutive Gaussian fittings for each different group of samples. We showed the mean values obtained using this procedure, with the wavenumbers and area values given within the confidence interval.
In the article “Enhanced Infrared Absorption in a Comparative Study between Multi-Sensitive and Multiresistant Bacteria of the Genus Klebsiella sp” [11], we studied the infrared spectral profile of Klebsiella sp bacteria with respect to sensitivity and resistance. The differentiation between these organisms can properly guide the therapeutic conduct. We processed the samples obtained from the laboratory of Hospital Santos Dumont in a Mac Conckey culture medium. After that, we processed a micromass in order to provide a thin film for evaluation by means of FTIR spectroscopy. The pilot study was performed using both glass slides and glass slides coated with a copper sheet of 45 μm thickness as support for the samples. After the bibliographical review, we highlighted the relationship between the amino acid serine and bacterial resistance in this type of bacteria, which occurs through plasmids. We collected the spectra from 50 bacterial strains divided in two groups: 25 sensitive and 25 resistant strains on glass, and 21 sensitive and 21 resistant strains on the copper sheet. We obtained the composition of the samples by evaluating the spectra with multivariate analysis using the second derivative. We concluded that infrared spectroscopy could also be used to identify multiresistant Klebsiella sp by means of the amino acid serine, which can be considered as a marker found only in multiresistant forms.
Handling with lymph nodes, we wrote the article “Estudo de linfonodos por espectroscopia Raman confocal” [2], in which we aimed to identify the main biochemical characteristics in normal and compromised lymph nodes, and in cervix lesions, using confocal Raman spectroscopy. We used spectroscopic methods to analyze 12 normal and altered lymph node samples from patients with medical indication for lymphadenectomy. We performed the statistical analysis of the main components (PCA) and linear discriminant analysis (LDA) [12]. In a subsequent work on lymph nodes, we studied these kinds of tissues by means of the SERS effect [3], using the following technique: we prepared a support matrix for the samples on a glass slide that was covered with a thin layer of chitosan, on which we deposited silver nanoparticles.
Materials and Methods
1. Spectrophotometers: in most of the articles presented here, the instrumentation and measurement
conditions were as follows: 1) Infrared spectra: we captured the spectra using a Spectrum 400 FT-IR
(Perkin-Elmer) spectrometer equipped with a MCT (mercury cadmium telluride) detector in the region
of 4000 to 400cm-1, with gain of 1 and resolution of 4cm-1. We recorded between 50 and 120 spectra. We
took a background spectrum in order to subtract any possible interferences from the external environment,
in some cases including the slide glass itself. 2) We used a confocal Raman system from River Diagnostics
(River Diagnostics® model 3510 -Netherlands), with 785nm laser diode as the excitation source. The power
on the sample was set to 20mW, and the exposure time was of 22 s (with accumulation of 1s). The laser spot
was of approximately 2μm, and the Raman signal was collected with a CCD detector.
Besides, in some cases we recorded the Raman spectra of the solid samples at room temperature with a Bruker Spectrometer (model RFS 100/S) equipped with a 1064 nm Nd:YAG laser as the excitation source. Acquisition parameters were: 500mW for laser power, spectral resolution of 4 cm-1, signal gain of 1, 200 scans and 7.0mm for aperture setting.
2. Computational devices: we used the following software: HYPERCHEM [13], GAUSSIAN 03 [14], and CHEMCRAFT 1.8 [15]. Theoretical structural calculations provided the structural parameters which we used to obtain the calculated vibrational spectra. The computations were carried out in a computer with the following configuration: Intel® Core™ i5 (1.80GHz) with 4GB of RAM.
Results and Discussion
The second spectral derivative is a spectroscopic technique used in order to obtain information about the
hidden bands under broad and intense band profiles. The positions of the most intense peaks with negative
values in the second derivative spectra also indicate how to proceed with the band deconvolution analysis.
In the article on thyroid cancer, we used this technique applied to the Amida I bands. Thus, we analyzed the
protein composition and inferred about its variations in different tissues. Figure 1 illustrates this procedure
for normal thyroid tissue showing the second spectral derivative in blue, the Amide I band profile in black
and the FSD in red.
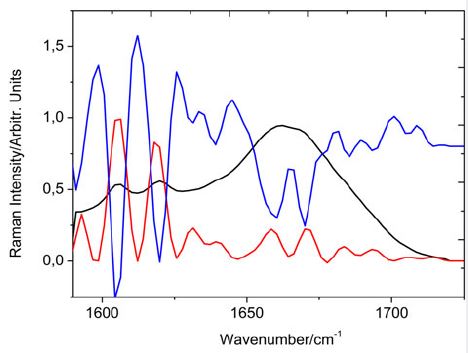
From Figure 1, we can conclude that the hidden bands between the second derivative and the FSD are coincident. On this graph, we warn some authors about the theoretical inconsistency of measuring the areas of the second derivative to infer concentration results for the different structural compositions of the Amida I band. For example, the bands designated as side chains, which appear at 1605 and at 1619 cm-1, have nearly equal intensities in the Raman spectrum. Both in the second derivative and in the Fourier proper deconvolution, these bands show higher intensities. The second derivative bands are dimensionless and do not include concentration, which is an intensive variable. The mathematical expression of Raman intensities contemplates concentration.
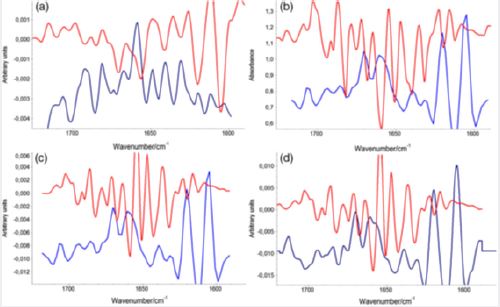
The protein structure does not have a high point group, with several symmetry elements. On the contrary,
due to its helical structure, composed of different types of amino acids, the only symmetry element of this
structure is the identity, E. Hence, the symmetry selection rules in vibrational spectroscopy indicate the same activity in both the Raman and the infrared spectra, which therefore coincide with respect to the number and
position of the bands. The only difference that these spectra show is their intensity: symmetrical vibrations
are most intense in the Raman spectrum and asymmetrical vibrations are most intense in the infrared
spectrum. Since we had already recorded the infrared spectra of these tissues, we obtained their second
derivatives and performed the inversion of the second derivatives of the Raman spectra in the spectral region
between 1800 and 1550 cm-1. Figure 2 illustrates the coincidence between the positioning of the bands in
both spectra.
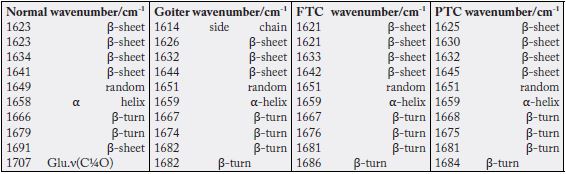
From the deconvolution results, we achieved a clear differentiation between the confocal Raman spectra of the four sample groups. We can consider side chain bands as constant in normal thyroid tissue, papillary, follicular, and goiter, with percentage values of 16%, 15%, 14%, and 13%, respectively. The β‐sheet bands predominate in normal thyroid tissue, with 20%, followed by the goiter samples, with 17%. For the papillary and follicular carcinomas, the percentages were of 15% and 14%, respectively. The α‐Helix secondary protein structure was higher in the papillary carcinoma, with a percentage of 45% compared with the normal tissue (22%) and CFT samples (22%). The α‐Helix structure was absent in the goiter samples. Goiter was the only sample which presented the 310‐Helix structure with the highest percentage (56%) with a band located at 1661 cm-1 [16,17]. The 310‐Helix structure is also found in the normal tissue with 12% and in the follicular carcinoma with 16%. The β‐turn secondary structure presents 28% in the normal tissue, 25% in the follicular carcinoma, and 24% in the papillary carcinoma. In goiter samples, the β‐turn structure indicates 13%. Table S2 and Table 3 depict the Gaussian fitting and band areas in the Amide I spectral region between 1580 and 1720 cm-1, as obtained from the confocal Raman spectra for the four groups of samples. As happens with the vibrational spectra of proteins, where there is no symmetry center or a specific point group (only the C1 group), the positions of the bands must coincide in the IR and Raman spectra, but with different intensities. Therefore, the corresponding assignments of the deconvolution bands was done mainly based on literature data for the IR spectra [16, 18-20].
In the paper RM1 semi-empirical and DFT: B3LYP/3-21G theoretical insights on the confocal Raman
experimental observations in qualitative water content of the skin dermis of healthy young, healthy elderly and
diabetic elderly women’s [8] that we took as a base for deconvolution band analysis, the second derivative
spectra are indications for the Gaussian fitting, Lorentzian fitting, or for other deconvolution functions.
The number of fitting bands must not exceed the number of indicative peaks found by the second derivative
spectra, and the fitting procedure has to be repeated at least three times in order to obtain sound statistical
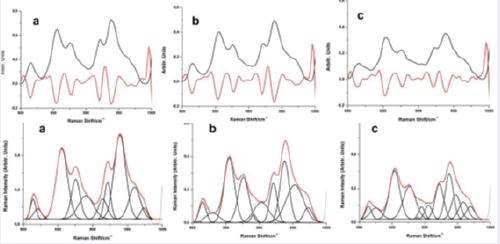
parameters for the band deconvolution procedure. Figure 3 shows the band deconvolution analysis for the
mean confocal Raman spectra of the diabetic elderly women (DEW), healthy elderly women (HEW), and healthy young women (HYW) volunteers in the proline and hydroxyproline spectral region, and we present
the second derivative spectra of the proline and hydroxyproline bands for these groups of participants.
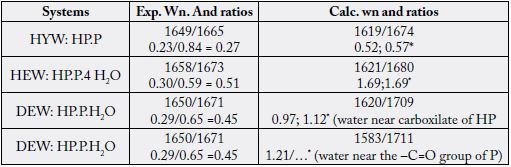
Nguyen et al., 2013 [21] indicates the ratios of the integrate intensities for the vibrational modes in the
Amide I region. In our case, the following integrate intensities were: 1656/1671 = 0.45 for DEW, 1657/1673
= 0.51 for HEW, and 1649/1665 = 0.27 for HYW. This represents the values of 37%, 42%, and 22% of
water/collagen interactions, showing that for HYW the compactness of the collagen fiber bundles is higher
than in DEW and HEW. We can translate this observation and state that the HYW group has a lower
water content in the collagen triple helix than the DEW and HEW groups, and with the lower quantities
in the DEW volunteers. Carbonyl stretching ratios in the HP.P, HP.P.4H2O, and HP.P.H2O systems
representing the calculated Amide I band found for young, elderly, and diabetic elderly women indicates the
calculated relative Raman intensity ratios.
In our studies on the dermal water content among healthy elderly women, diabetics and healthy young women
[11], the software that controls the confocal Raman spectrophotometer determines the water content taking
into account the spectral region of the CH stretch bands, as well as a band in the spectral region above 3000
cm-1. If another Raman spectrophotometer were used to conduct such studies, it would not be possible to use
the software provided by Rivers Diagnostic. Between 3000 - 3750cm-1, in both the Raman and the infrared
spectra, the band representing the normal OH stretching mode is broad and intense. Within the profile of
this band, the bands of combinations and overtones of chemical bonds and of the characteristic chemical
groups are hidden, as well as the symmetrical and antisymmetric stretching bands of the primary amines.
Since we wanted information about the dermal water content, we determined the average spectrum of each
group and chose the spectral region mentioned above. We then recorded the Raman spectrum of pure water
according to the following specifications: Milli-Q ultrapure water (Millipore Durect-Q3 water purification
System) as a reference. Two drops of Milli-Q ultrapure water (0.07mL) were placed on a confocal Raman
lens (with an area of 6cm2), corresponding to 12 microliters per cm2. The measurements were performed in
the spectral region classified as high-frequency (2500 - 4000cm-1). The same parameters were used for the
three groups of participants (healthy young, diabetic and non-diabetic elderly women).
Subsequently, the spectrum of the pure free water was substracted from the Raman spectra of each set of samples. The process of substraction was performed using the Omnic software from Spectra Thermo Fisher (US, USA) [22], which was also used to determine the second derivative spectra and the Fourier selfdeconvolution spectra (FSD) that we employed to find out the hidden bands below the band profile in the 3150 - 3700cm-1 region. Figure 4 illustrates the result of such procedure.
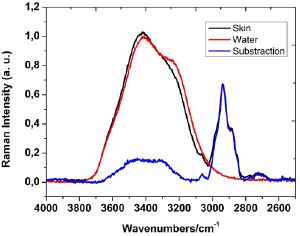
Figure 5 shows the band profile resulting from the subtraction of pure water from the second spectral derivative, as well as the band profile generated by the FSD.
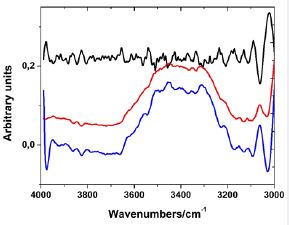
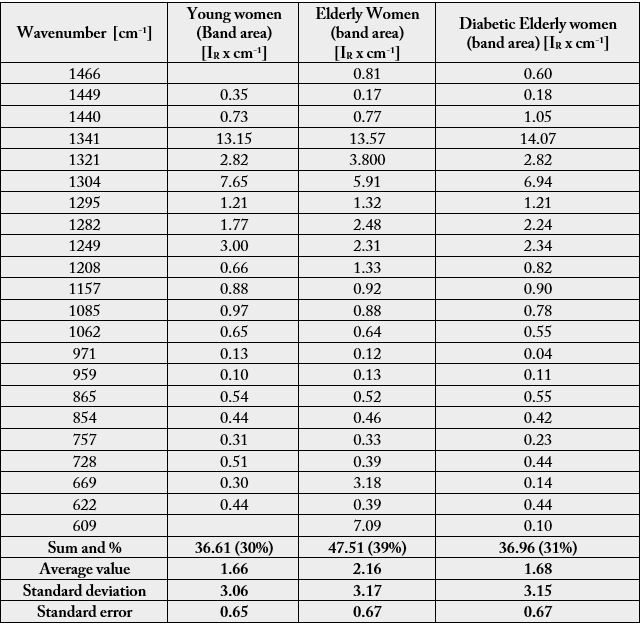
As results in Table 3 we present the vibrational assignment of the second derivative (or FSD bands) in the 3150-3700 cm-1 region of the mean Raman spectra of elderly diabetic women.
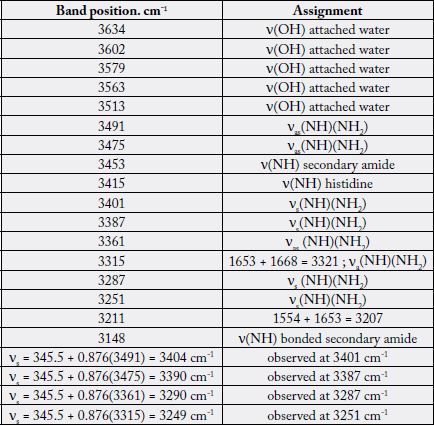
Bellamy-Williams equation for primarey amines. Ex. Subtraction spectra between EDW and water [23].
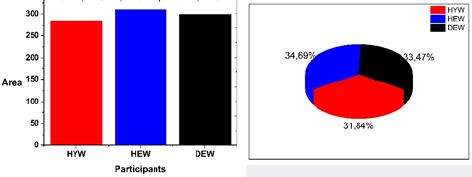
Figure 6 summarizes the results obtained using the procedure descrived above for the three groups of participants. Notice that the DEW value of 33.47% reflect the glucose action according his higher water solubility in the triple helix chanel.
As the increased factor of infrared absorption is several units of magnitude lower in comparison to the SERS
effect, the Surface Enhanced Infrared Absorption Spectroscopy (SEIRA) effect has been less studied. The
first work on the SEIRA effect is by A. Hartstein et al [24]. The paper by Osawa [25] provides an excellent
review on the SEIRA effect and, in the summary, Osawa states that molecules which are absorbed on films
of metal island particles exhibit infrared absorption between 10 - 1000 times greater than ordinary infrared
records. In our case, we obtained an absorption increase of the order of 400%.
In order to characterize the copper sheet, we used a Scanning Electron Microscope (SEM) from Zeiss (EVO MA 10). The thickness of the copper sheet oscillated between 42.05 and 48.79µm.
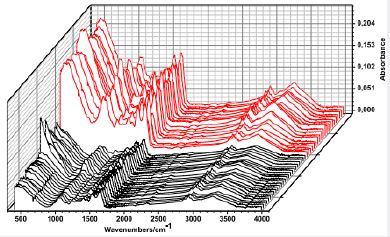
Figure 7 shows the increase in the absorbance of the infrared spectra (FT-IR), according to what was recorded for the bacteria samples on the ±45µm copper plate (red) and on a glass plate used to the collect the samples (black). Observing the absorbance scale we can appreciate an enhancement around 400 for the samples deposited on a thin copper sheet.
In the paper “Combined in vivo confocal Raman spectroscopy and density functional theory to detect carboxymethyl(lysine) in the human stratum corneum” [6], in order to identify the presence of the glycation product carboxymethyl(lysine), we recorded the confocal Raman spectra of the stratum corneum from a set of volunteers. Next, we calculated the mean value of these spectra and their second derivative. The next step was to obtain the CML spectrum by means of theoretical calculations based on the Density Functional Theory (DFT), using the B3LYP functional with basis set 6-311G (d, p). After correcting the harmonic spectrum, it was compared with the second spectral derivative of the average spectrum of the stratum corneum. Spectral coincidences indicated the present CML bands. Figure 8 presents the coincident bands between the second derivative mean value spectrum of the skin stratum corneum of the EDW group of participants, together with the experimental confocal Raman spectrum of CLM.
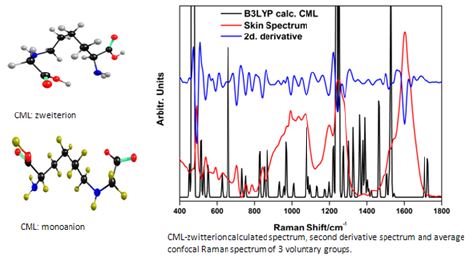
Table 4 presents the 22 fundamental bands of carboxymethyllisine with their respective areas as present in the confocal Raman spectra of the three groups of voluntaries. The band areas were obtained by the deconvolution band procedure.
Among the lymphoid organs, there are the lymph nodes, which are considered as lymph filters because they
are rich in lymphocytes and other defense cells. Among the factors that contribute to their impairment, we
note the invasion of its structure by neoplasic cells. Cytology is the gold-standard diagnostic test, and FNA
is the most used technique to obtain the material to be analyzed. However, some studies question its use, due
to the loss of cellular architecture. Confocal Raman spectroscopy, through its ability to utilize biochemical
differences in tissues and cells, has been increasingly prominent in this type of diagnosis. The study aimed to
identify the main biochemical characteristics in normal and compromised lymph nodes and cervical lesion
using confocal Raman spectroscopy. We analyzed 12 normal and altered lymph node samples from patients
with medical indications for a lymphadenectomy by spectroscopy, followed by statistical analysis of the main
components (PCA) and linear discriminant analysis (LDA). After the analysis, it was observed that this
technique was able to discriminate the tissues with values of specificity, sensitivity and accuracy of up to 83%.
Therefore, confocal Raman spectroscopy has been shown to be an important tool in the characterization of
lymph nodes, and in the future it may help in the diagnosis of lymph node lesions.
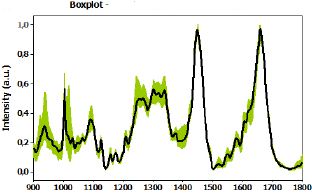
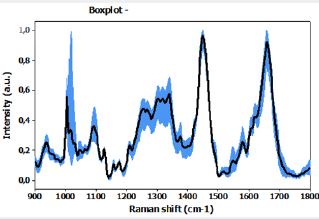
In the statistical analysis, we first used the OriginPro 8 software [26] to obtain the mean and standard deviation spectra for all samples in the region between 900 and 1800 cm-1. Next, we used the Minitab® software [27] to classify the spectra according to the Principal Component Analysis (PCA), a statistical method that separates the original variables of a group according to their similarities from the analysis of the scatterplot associated to the loading plot, and according to supervised methods such as Linear Discriminant Analysis (LDA). In addition, we determined the sensitivity, specificity, and accuracy values of the test by means of a contingency matrix based on the values found by the PCA analysis associated with the histopathological results.
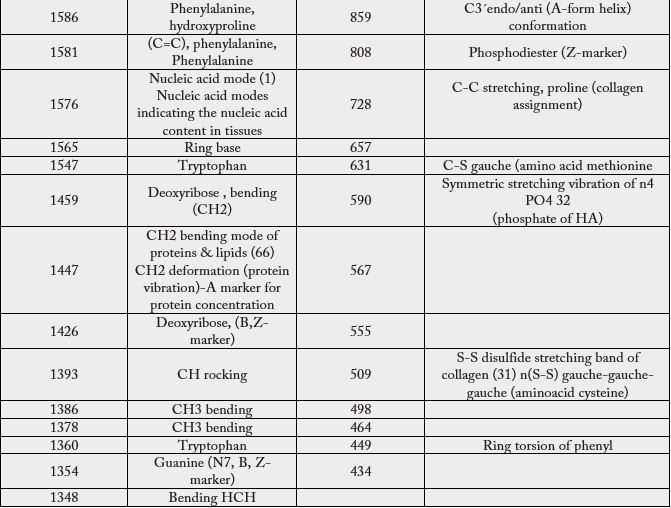
From the loading plot, we obtained the main peaks and attributions that were identified for the normal and compromised lymph node groups. Comparative spectra are shown in Figure 9, and Table 5 presents the band assignment for the two kinds of tissues.
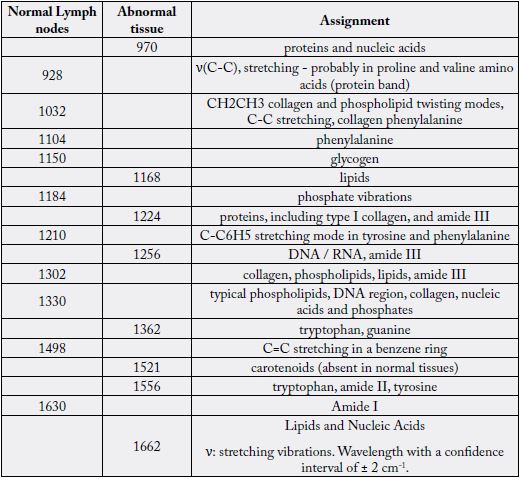
Movasaghi, Z.; Rehman, S.; Rehman, I.U. Infrared Raman Spectroscopy of Biological Tissues, Applied Spectroscopy Reviews, 42:5, 493-541, 2007 [28].
At the EMBRAER Congress realized in Campos de Jordão (SP), Brazil (2018), we presented a work on normal and abnormal tissues of lymph nodes, focusing our attention in the SERS effect [3].
First, we took the Raman spectrum by depositing the sample on a glass slide. Then, on another slide, we deposited a thin layer of chitosan and recorded its spectrum in order to subtract it later. We placed silver nanoparticles on the top of chitosan [29]. Next, we placed the compromised tissue sample and record the SERS spectra. The obtained spectra are shown in Figure 10. Despite indicating the spectral differences between tissues, we concluded that confocal Raman spectra treated by statistical procedures do not provide the broad and impressive information provided by SERS.
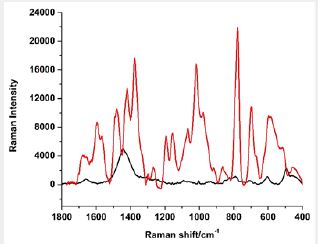
In Table 6 we present the observed SERS bands of the abnormal lymph node.
Conclusion
Comparatively, the statistical treatment provides only eight bands that differ from the spectrum of healthy
lymph nodes, however, by the SERS effect, according to the measurement techniques that we have indicated,
we obtained 55 bands, of which only three of them were coincident with the spectrum generated by the
statistical procedure. Statistical procedures are excellent to deal with the goodness of the data and to point
out differences between different sets of measurements, however, they are unsatisfactory to predict the
numerical magnitude of a vibrational spectrum, even more if in this measurement techniques that lead to an
increase in the intensity of the bands are used, such as like the SERS (Raman) and SEIRA (infrared) effects,
or another equivalent like the one we present in this review.
Disclosures of Interests
The authors have no financial interests in this article and declare no conflict of interest.
Acknowledgments
C. A. Téllez, thanks to FAPESP (process number 2019-00558- 8).
Bibliography


Hi!
We're here to answer your questions!
Send us a message via Whatsapp, and we'll reply the moment we're available!