Biography
Interests
Catovic, A.1*, Pleho-Kapić, A.2, Voljevica, A.3, Suljević, A.4 & Suke, S.4
1Department of Hygiene, Faculty of Medicine, University of Sarajevo, Bosnia and Herzegovina
2Department of Pathophysiology, Faculty of Medicine, University of Sarajevo, Bosnia and Herzegovina
3Department of Anatomy, Faculty of Medicine, University of Sarajevo, Bosnia and Herzegovina
4Faculty of Medicine, University of Sarajevo, Bosnia and Herzegovina
*Correspondence to: Dr. Catovic, A., Department of Hygiene, Faculty of Medicine, University of Sarajevo, Bosnia and Herzegovina.
Copyright © 2021 Dr. Catovic, A., et al. This is an open access article distributed under the Creative Commons Attribution License, which permits unrestricted use, distribution, and reproduction in any medium, provided the original work is properly cited.
Abstract
Energy needs depend on several factors such as gender, age, growth, level of physical activity, and
body size. When the diet delivers excess of energy the body stores fat. To reduce body fat energy
expenditure need to be higher than energy intake. Beside by energy imbalance body composition can
be modulate by physical activity during recreational sports participation. This study aimed to assess
correlation between nutritional status indicators and dietary pattern in a sample of recreational
athletes.
A cross-sectional study was conducted during March and April 2017 on the area of Sarajevo Canton.
The study covered 50 recreational athletes both sexes, different age groups. The study protocol
included anthropometric measurements and a food frequency questionnaire. Anthropometric data
included height, weight, and waist and hip circumference. The whole-body level of body composition
is described by body mass index (BMI) and waist hip ratio (WHR). The FFQ included a list of 16
commonly consumed foods and beverages. Participants estimated usual frequency of consumption
by day, week, or month of each food and beverage queried. Statistical analyses were performed using
the Statistical Package for Social Sciences software (version 13.0).
Study revealed positive correlation between measures of adiposity and age at females. At males
there were positive correlations between rear consumption of milk and milk products, and fruits
with higher value of indicators of adiposity, as well as more frequent consumption of sodas and
these indicators.
There are many potential health benefits that can arise during recreational sports participation.
Recreational athletes train at various intensity so they need a variety of food choices that will
provide a balance of energy and nutrients in order to perform at an optimal level. Sometimes
nutritional needs are underestimated and restriction of some food group, like fruits and milk have
been adopted. Energy and nutrient density of food should be considering in diet choice.
Abbreviations
BMR - basal metabolic rate
BMI - body mass index
FFQ - food frequency questionnaire
SD - standard deviation
TEF - thermic effect of food
WHO - World Health Organization
WHR - waist hip ratio
Introduction
There are three basic components of a person’s energy output: maintenance expenditure, activity-induced
energy expenditure, and diet-induced expenditure [1]. The basal metabolic rate (BMR) is the minimum
energy expended to keep a metabolism at work in a day. There are variations in the expenditure of energy for
life-sustaining activities, depending on sex, age, and body mass. The highest BMR is seen with people who are growing and who are physically fit with significant lean body mass [2,3]. The diet-induced expenditure
is energy required to process food. Because of heat production this is named as thermic effect of food
(TEF) [4]. Activity energy expenditure is the most variable and the most changeable component of energy
expenditure. It has significant influence on weight. Differences in weight do not mean the same variation
in body composition of athletes and inactive people [3,5]. Body weight consists of fat (adipose), lean body
mass, and water. Components of lean body mass are muscle, organs, and bone. There is an ample reserve of
energy between 50,000 to 200,000 kcalories in healthy-weight adult that can be used between meals. One
aspect of body composition is distribution of fat in the body. Upper-body fat or central obesity is visceral
fat that is stored around the organs of the abdomen. Lower-body fat is subcutaneous fat around the hips
and thighs [3,6]. Aerobic exercise can decrease visceral fat stores in general populations [7]. A recreational
athletes participate in physically activities to be healthy, physically fit, socially involved, and to have fun. They
train at various intensity levels. To perform at an optimal level they need a variety of food choices [8].
This study aimed to assess correlation between nutritional status indicators and dietary pattern in recreational athletes.
Materials and Methods
A cross-sectional study was conducted during March and April 2017 in the area of Sarajevo Canton. The
study covered 50 recreational athletes of both sexes and different age groups. Simple random sampling was
used to select participants from different age groups.
The study was conducted according to the research ethics guidelines laid down in the Declaration of Helsinki [9]. Verbal informed consent was obtained from all participants.
Anthropometric data included height, weight, as well as waist and hip circumference. The whole-body level
of body composition is described by body mass index (BMI) and waist hip ratio (WHR). BMI is calculated
using weight in kilograms and height in meters (kg/m2). According to WHO guidelines [10] weight status
is classified into four categories: under-weight (BMI ≤ 18.5), normal weight (BMI between 18.5-24.9),
overweight (BMI between 25-29.9), and obese (BMI ≥ 30). WHR (i.e. the waist circumference divided by
the hip circumference) is a measure of body fat distribution. It provides an index of both subcutaneous and
intraabdominal adipose tissue. Abdominal obesity is defined as WHR above 0.90 for males and above 0.85
for females (determined for European men and women, respectively) [11]
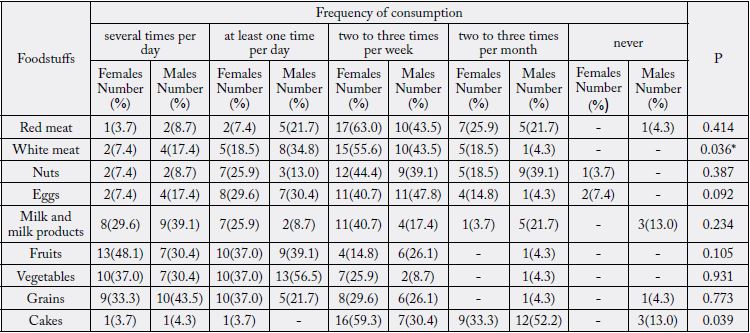
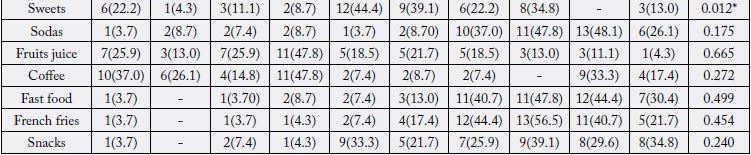
Dietary data were obtained by food frequency questionnaire (FFQ) [12]. The used items in the FFQ were divided into 16 food and beverage’s groups: fruits, vegetables, nuts, red meat, white meat, eggs, milk and dairy products, grains, cakes, sweets, chips, fried potatoes, fast food (hamburger, hotdog, sausages), coffee, fruits juices, sodas. The FFQ asked how often each food or beverage group, was usually consumed with five possible answers for each of the food categories: (1) several times per day, (2) at least one time per day, (3) two to three times per week, (4) two to three times per month, and (5) never.
Statistical analyses were performed using the Statistical Package for Social Sciences (version 13.0, SPSS, Inc)
software. Continuous data were presented as mean and standard deviation (SD) and compared using Student
t-test. In the bivariate analysis, the association of anthropometric measures were estimated according to age
and the foodstuffs consumption pattern. Differences were considered statistically significant at p<0.05.
Results
A sample included 50 participant, of which 27 (54.0%) were female and 23 (46.0%) were male.
The mean age of female participants was 21.82±1.35 year, and for male participants was 25.22±1.14. There was no significant difference between genders in relation to age (Student t test: p=0.065; p<0.05).
The anthropometric characteristics of participants were presented in Table 1.
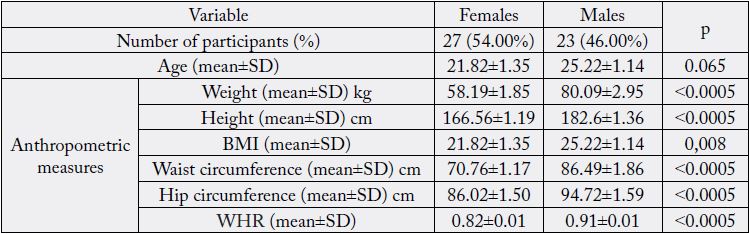
For females the mean weight was 58.19±1.85kg, the mean height was 166.56±1.19cm, the mean BMI was 21.82±1.35kg/m2, the mean waist circumference was 70.76±1.17cm, the mean hip circumference was 86.02±1.50, and mean WHR was 0.82±0.01. For males the mean weight was 80.09±2.95kg and the mean height was 182.6±1.36cm, the mean BMI was 25.22±1.14kg/m2, the mean waist circumference was 86.49±1.86cm, the mean hip circumference was 94.72±1.59, and mean WHR was 0.91±0.01.
Between gender there were significant differences in relation to anthropometric measures.
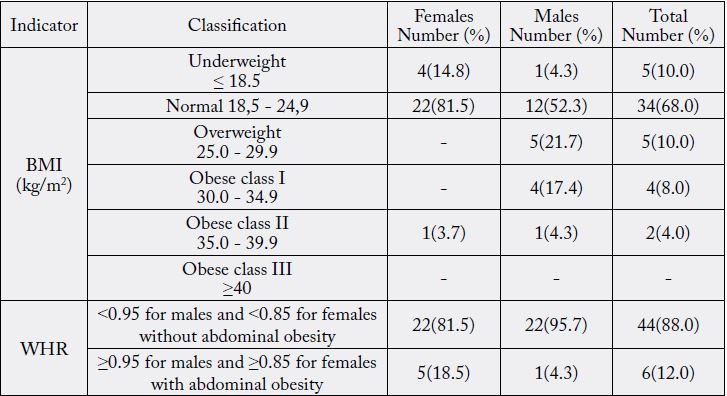
It is showed by Table 2 that the majority of the participants (68.0%) were of normal weight. BMI > 24.9 was found at 11(22.0%) participants, whereas 5 (10.0%) participants were underweight. Abdominal adiposity, defined by WHR, was found at 6(12.0%) participants.
Comparison of consumption frequency of different food stuff revealed no statistically significant difference between genders, expect for consumption frequency of white meat and sweets (Table 3). One quarter of the sample of male population (26.1%) restricts consumption of fruits to two to three times per week.
Correlation between nourishment status, age and dietary pattern is showed in table 4.
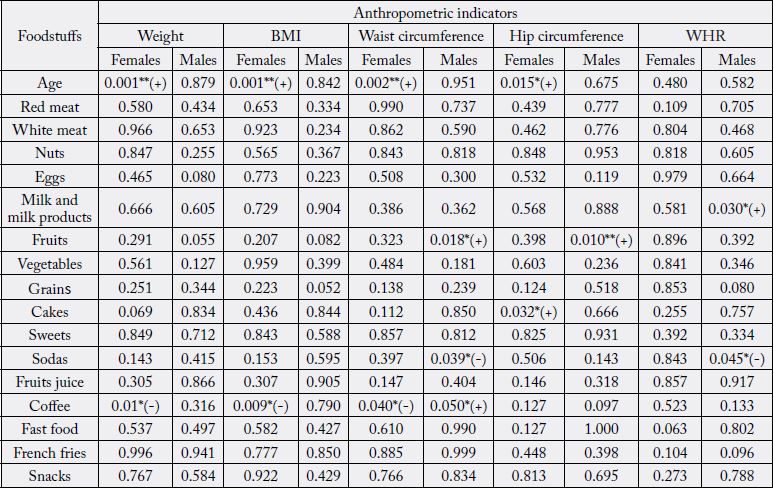
*Correlation is significant at the 0.05 level **Correlation is significant at the 0.01 level
Females displayed positive correlation between measures of adiposity and age. Pattern of coffee consumption correlated with measures of adiposity in different way for females and males. Females who consumed coffee less frequently, had a higher weight, BMI and waist circumference. On the contrary, males who consumed less frequently had a lower waist circumference. Our study showed that less frequent cake consumption correlated with higher hip circumference for females. As for the male sample, we found WHR was higher with less frequent consumption of milk and milk products, whereas waist and hip circumference was higher with more rear consumption of fruits. More frequent consumption of sodas correlated with higher waist circumference and WHR.
Discussion
The purpose of this study was to investigate the relationships of nutritional status indicators and dietary
pattern in a sample of 50 recreational athletes. A cross-sectional study was conducted during March and
April 2017 in the area of Sarajevo Canton. Nutritional status indicators used were anthropometric measures:
height, weight, waist and hip circumference, as well as their derivates: BMI and WHR. BMI is adopted
as the anthropometric measure of body size for general population. WHO stated that in 2016, 39% of
adults, aged 18 years and over, were overweight based on BMI, and 13% were obese [13]. In our sample
we found BMI > 24.9 at 11(22.0%) participants. Alternative measure that reflect abdominal adiposity is
WHR. In our sample abdominal adiposity, defined by WHR ≥0.95 for males and ≥0.85 for females, was
found at 6(12.0%) participants. Muscles are more dense and heavier than fat, and muscular athletes may
be classified as overweight by BMI standards, but not be fat [3]. Moreover using BMI categories as the
main indicator of health, there is possibility of misclassification of cardiometabolic health [14]. In our
study there was positive correlation between measures of adiposity and age at females. There is smaller
elevation in whole body adiposity across age in the exercising women [15]. Dietary pattern of males revealed
that less frequent consumption of milk and milk products, as well as fruits correlated with higher value of
anthropometric indicators. On the other hand, more frequent consumption of sodas correlated with higher
waist circumference and WHR. The impact of sodas on adiposity was evaluated in numerous studies with
opposite results [16], as well as the impact on health [17].
Conclusions
There are two main limitation of our study: its cross-sectional design and lack of information about serving
size of commodities. Nevertheless it provides baseline information about anthropometric indicators and
dietary pattern. Maintaining an active life-style is important for fitness and health. There are different
recommendation about physical activity that can be adopted in group. Sometimes nutritional needs are
underestimated and restriction of some food group, like fruits may be adopted. Recreational athletes train
at various intensity so they need a variety of food choices that will provide a balance of nutrients in order
to perform at an optimal level.
Conflict of Interests
The authors declare that they have no competing interests.
Bibliography


Hi!
We're here to answer your questions!
Send us a message via Whatsapp, and we'll reply the moment we're available!