Biography
Interests
Oluwasola Julius OKE*, Samuel Ademola ADEGOKE & Oyeku Akibu OYELAMI
Department of Pediatrics, Wesley Guild, Obafemi Awolowo University Teaching Hospital, Ile Ife, Nigeria
*Correspondence to: Dr. Oluwasola Julius OKE, Department of Pediatrics, Wesley Guild, Obafemi Awolowo University Teaching Hospital, Ile Ife, Nigeria.
Copyright © 2021 Dr. Oluwasola Julius OKE, et al. This is an open access article distributed under the Creative Commons Attribution License, which permits unrestricted use, distribution, and reproduction in any medium, provided the original work is properly cited.
Abstract
Childhood malnutrition poses both short and long term burden to children. Many children have
low cognitive function sequel to long term effect of malnutrition. The adverse effects of malnutrition
on the cognition of children have not been well researched in Nigeria, hence this study determined
the Intelligent Quotient (IQ) and academic performance (AP) of children with malnutrition and
compare with that of children without malnutrition.
The study was done among 1280 randomly selected pupils aged 5-11years in Ilesa. Sociodemographic
information was obtained from the parents through a self-administered questionnaire. Nutritional
status was assessed by measuring weight, for height, height-for-age, weight-for age and weight-forheight
z-score of the pupils. Intelligent quotient and Academic Performance were assessed with
draw a person test (DAPT) and Continuous assessment (CA) scores respectively.
About one-tenth (9.2%) of the pupils had Poor academic performance while 90.8% had good
performance. In this study, 70.8% of the stunted had subnormal IQ (p=0.001) while and 60.1%
of the underweight pupils had subnormal IQ (p=0.004). Twenty six (16.9%) stunted pupils had
poor academic performance while 87 (8.4%) of children with optimal height had poor academic
performance (χ2 =13.184, p = 0.002). There is significant association between socio economic factors
and cognition.
The Stunted and underweight pupils with low socio class had higher association with subnormal
intelligence and poor academic performance in this study. Hence, good nutrition especially in early
years of life and improved socio economic factors will assist to improve cognition among Nigerian
pupils.
Introduction
Cognition is the mental processes involved in acquiring knowledge and comprehension. It is a higher-level functions in problem solving. Cognition of a child can be evaluated by assessing the intelligence quotient and the academic performance or achievement [1]. The intelligence quotient can be assessed with psychometric tools in which IQ is defined as mental age / chronological age multiply by 100. Academic performance can be assessed with continuous assessment or achievement test [2,3]. Malnutrition is a state of imbalance between supply of nutrient and utilization causing adverse effects on tissue function [4]. It can be an overnutrition (occurring from over consumption of nutrients more than the body metabolic requirement) or under nutrition (resulting from inadequate nutrients intake require for normal development) [5]. Goon DT et al observed that about a quarter of children below aged 5years in sub-Saharan Africa are undernourished and the prevalence of under-nutrition in school-aged children varies across different regions in Nigeria ranging from 0.4% in the South East to 53% in the North West of the country [6].
The building block for sound mind and health is laid during the early years of life which is the critical period of growth [4]. Malnutrition during this crucial period may lead to irreversible mental deficit, psycho-social imbalance and poor academic performance [4,5]. Studies have shown that poor nutrition leads to cognitive impairment and stunted growth [7,8]. Several evidences also exist that poor nutrition is associated with stunted growth and delayed mental development, poor school performance and intelligence quotient [9,10]. Cognition is well enhanced by optimal nutrition particularly in the first 2 years of life when over 50% of the adult brain size is achieved [11]. Under-nutrition in early life may adversely affect future cognitive potentials. Chronic malnutrition often leads to neuro -pathological changes in the brain with consequential cognitive impairment later [11-13]. Among the psychometric tools for IQ determination, DAPT has been culturally friendly and has been found to be useful across different ethnic and geographical backgrounds in the world [14-17]. It assesses the child’s capability to reproduce the human image concept by drawing body parts and placing them appropriately to each other proportionately. It is easier to use and cultural friendly than other psychometric tools [15,16]. Moreover, this test has been earlier standardized and validated for use among Nigerian children [18]. Nutritional status and intelligence may be influenced by several factors such as parents’ social status, parents’ education, and family size [19-21]. The impact of these factors on nutrition and the child’s intelligence is not well research in Nigeria. This study thus aimed at determining the relationship between the nutritional status and the cognition of the school-age children in Ilesa.
Materials and Methods
This survey was a descriptive cross-sectional study that involved 20 primary schools, across Ilesa metropolis.
Ilesa is the largest town in Ijesa land, situated on latitude 7°35´ N and longitude 4°51´E and is about 200km
North-East of Lagos [22]. A multistage sampling method was used to select the pupils. Ten public and
ten private schools in Ilesa metropolis were selected by simple random sampling among 31 private and 29
public primary schools in Ilesa. The number of pupils recruited from each school was based on proportionate
sampling method. Pupils were recruited from primary 1-6 classes at each selected school. The number of
pupils recruited from each class in the selected school was also determined by the proportionate sampling
method. Systematic random sampling was used to select the pupils from each selected class from their class
register putting into consideration the sex and age of the subjects.
A pilot study was carried out among 80 pupils in a school that was not involved in the main study to pre-test the research tool. The study questionnaires that consist of the pupils’ medical and social information, such as family size, parental educational were completed by the parents of the pupils. Questionnaires was completed and social status obtained using Olusanya et al social class classification [23].
Stadiometer was used to measure height to the nearest 0.1cm and the weight was measured to the nearest 0.1kg. WHO/NCHS growth references was used to determine the weight-for-age, body mass index and height-for-age z-scores (WAZ, BMIZ and HAZ, respectively). The reference z-scores for thinness (BMIZ < -2SD), underweight (WAZ < -2SD), stunting (HAZ<-2SD), overweight (BMIZ > +2SD) and obesity (>+3SD) were done.
Continuous Assessment for first and second term examinations of each pupil were graded as excellent (≥ 75%), good (50 - 74%) and below average (< 50%) [24,25]. Pupils were considered to have poor academic performance if the score was less than 50%. The record of school absenteeism of each pupil for the academic session was obtained from the attendance register and high school absenteeism were considered if number of days not present in class were > 10 school days [26].
Draw- a- Person test (DAPT) was used to evaluate the IQ of the school children after careful explanation (appendix ii and ii b) [18]. The intelligence quotient test scores were categorized into grades (I-V) and were subsequently re-classified into optimal (Grades I-III) and subnormal intelligence (Grades IV and V). The DAPT has good correlation with WISC, Standford-Binet and ravens [27]. The children were all examined clinically and the head circumference, weight and height, vision and the hearing of the pupils were assessed.
The procedures followed were in accordance with the ethical standards of Obafemi Awolowo University
Teaching Hospital complex (OAUTHC) research and ethical committee and with the Helsinki Declaration
of 1975, as revised in 2000. Approval was sought and obtained from the Zonal inspector of education in
Ilesa. Permission was also taken from headmaster/headmistress and class teachers of the selected pupils.
Written informed consent was obtained from the parents/guardians, while assent was obtained from the
pupils.
All apparently healthy school children aged 5-11 years whose parents (guardians) gave consent while they
themselves assented to the study were included.
Pupils below the age of five years and above the age of eleven years and those who declined participation
in the study. Children whose parent(s) / guardian(s) did not give consent and those with history of mental
deficit, seizure or cerebral palsy chronic or acute illnesses were excluded.
Data were processed using the statistical software package SPSS 20. The mean and standard error of the mean
(SEM) values of age, weight, height, height-for-age z-score, head circumference, and IQ were determined.
The spearman correlation coefficients were calculated in order to decide if inter-correlated variables may
be included as predictor variables. Chi-square was used to determine the association between IQ and
nutritional status, as well as academic performance and nutritional status. Fisher’s exact test was also used for
cells that had values less than five. The level of significance for the chi square test was p <0.05. Binary logistic
regression analyses were performed between socio-demographic characteristics (independent variables), the
nutritional status and IQ as well as academic performance (dependent variables) of the pupils. The strength
of association was evaluated with odds ratios (OR) and the corresponding 95% confidence intervals (CI).
Result
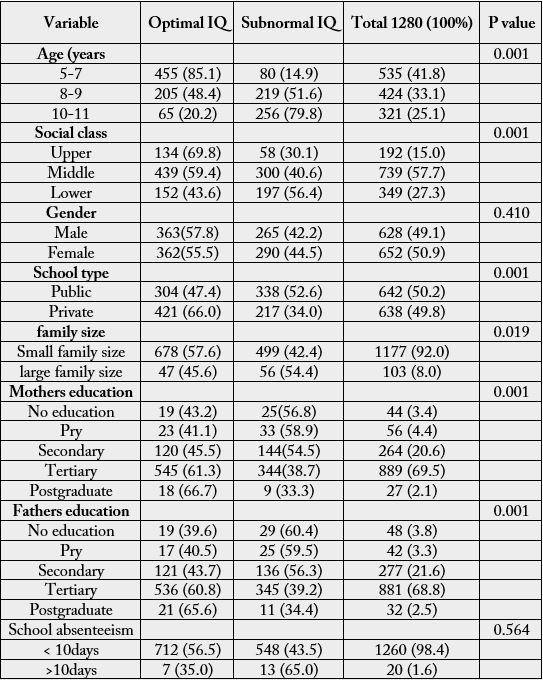
The measured parameters and their means in the study were as follows: age, 7.94±1.83 years; weight,
24.32±5.67kg; height, 1.26±0.11m; height-for-age z-score, -0.02±3.25, weight for age z-score -0.54±1.04
and IQ, 76.85±15.35, OFC 53.09±1.67, Continuous Assessment 67.42±11.56, BMI 15.24±1.79.
Twenty two percent of the parents of the pupils were artisan, 0.6% of were unemployed, 62.6% were civil
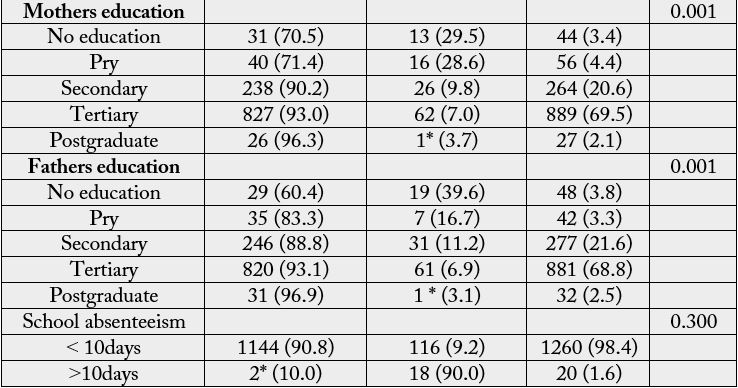
servant and 14.8% were professionals. About two third (69.5%) of the pupils’ mother had tertiary education,
3.4% had no formal education, 4.4% had primary education, 20.6% had secondary education and 2.1% had
postgraduate education. Also, about two third (69.9%) of the father of the pupils had tertiary education, 3.8% had no formal education, 3.3% had primary education, 20.5% had secondary education and 2.5% had
postgraduate education. The percentage of Males was 49.1% and females 50.9% respectively. About half
(57.7%) of the pupils were from the middle class, 15% are in upper class, and about a quarter (27.3%) are
in lower class. About a quarter (25.1%) of the pupils were aged are 10-11 years, one third of the pupils were
aged 8-9 years and 41.8% were between 5-7 years. Above 90% of the pupils were from small family size
while less than ten percent (8%) were from large family size. Both Pupils from Public and private school
were also averagely represented as 50.2% and 49.8% respectively.
The DAPT IQ scores as seen in Table 1 showed that 33.3% of the pupils had deficient IQ, 37.8% had
borderline IQ and 28.9% had optimal IQ
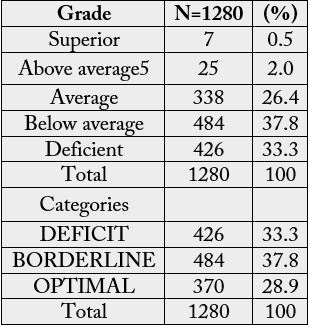
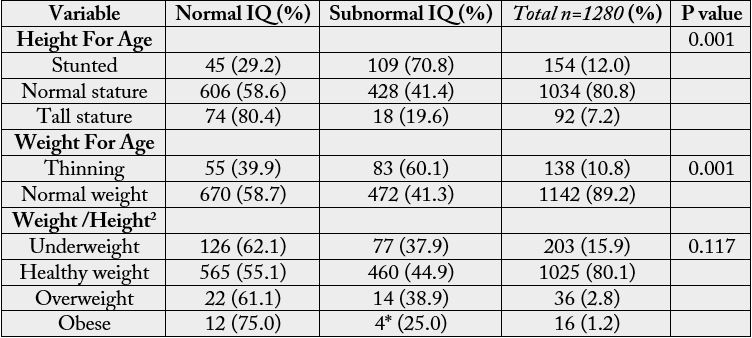
Table 2 showed relationship between nutritional status and intelligent quotient of the pupils while Table
3 showed nutritional status and academic performance of the subjects. Above two third (70.8%) of pupils
with stunting had subnormal IQ while 39.6% of children with optimal height had subnormal IQ. The
IQ score of the pupils and their height for age was statistically significant (χ2 =69.983, p = 0.001). Sixty
percent of the pupils with thinning had subnormal IQ while 41.3% of children with optimal weight had
subnormal IQ. There was statistically significant difference in the IQ score of the pupils and their weight
for age (χ2 =19.432, p = 0.001). About seventeen percent (16.9%) of pupils with stunting had poor academic
performance while 8.2% of children with optimal height had poor academic performance. The academic
performance score of the pupils and their height for age was statistically significant (χ2 =13.184, p = 0.002).
There was no statistically significant difference in the academic performance score of the pupils and their
weight for age (χ2 =10.375, p = 0.007).
*Fisher's exact test
*Fisher's exact test
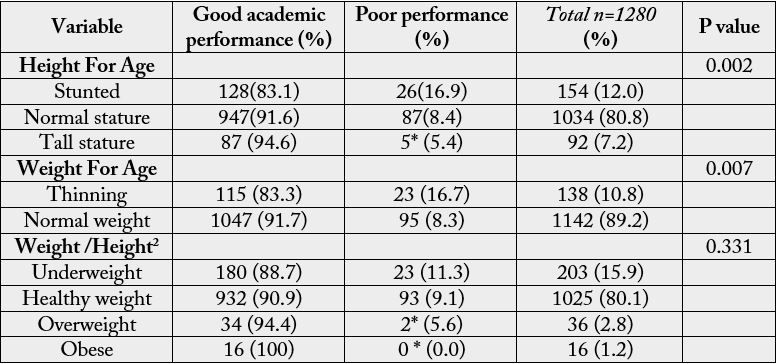
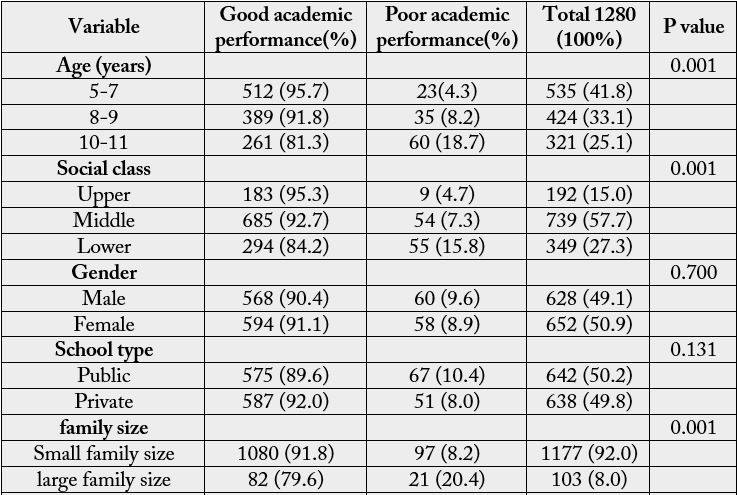
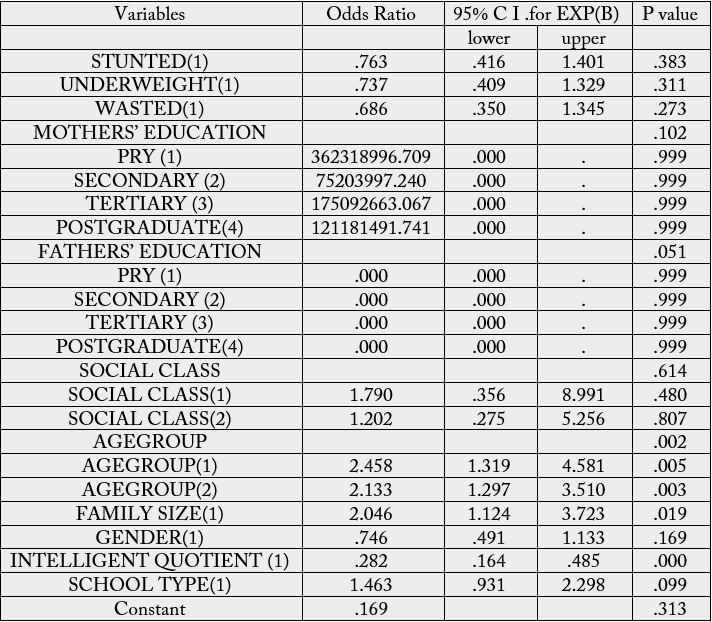
Table 4 and 5 revealed socio-demographic factors affecting academic performance and IQ of the subjects.
The relationship between socio-demographic characteristics such as the age groups, social class, school type,
mothers’ education, fathers’ education and academic performance of the pupils were statististically significant
(p = 0.001). The relationship between socio-demographic characteristics such as the age groups, social class,
school type, mothers’ education, fathers’ education and IQ of the pupils were statististically significant (p =
0.001).
*Fisher's exact test
*Fisher's exact test
Spearman’s correlation of pupils ‘age, height for age, weight for height, mothers’ education, fathers’ education,
IQ and academic performance of the subject is shown in Table 6. There were weak positive correlation
between academic performance score and IQ (r = 0.217, p = 0.001), Height for age and IQ (r = 0.205, p =
0.001), weight for height and IQ (r = 0.118, p = 0.001), mothers’ education and IQ (r = 0.155, p = 0.001),
fathers’ education and IQ (r = 0.144, p = 0.001) of the pupils (r = 0.217, p = 0.001). The age had a strong
negative correlation with the IQ of pupils (r = -0.531, p = 0.001). There were also similar correlation between
academic Performance and Height for age, weight for height, mothers’ education, fathers’ education and age
as it was with IQ.
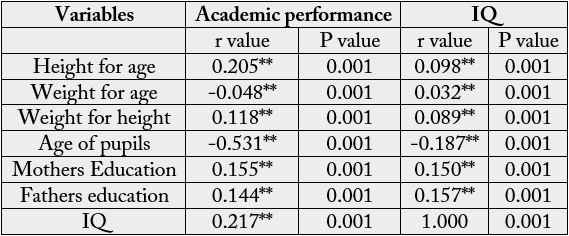
** =P value <0.01, *= P value <0.05, r is the correlation.
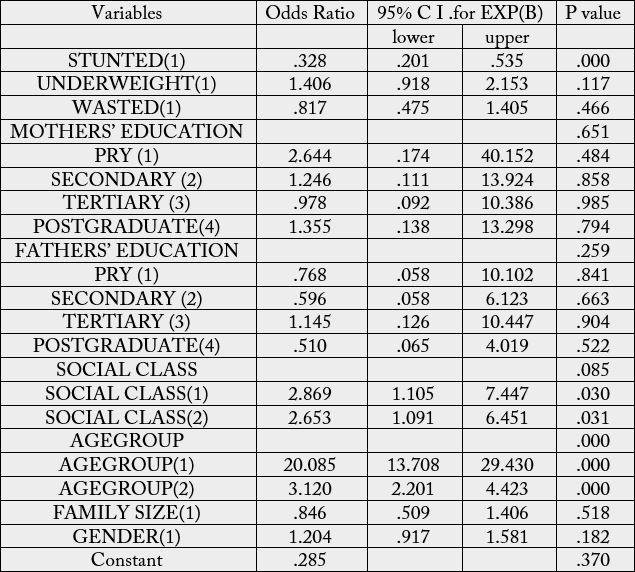
Logistic regression of factors associated with IQ and academic performance are shown in Table 7 and 8
respectively. Lower age group and not being stunted were associated with increased odds of having optimal
intelligence. Also higher IQ and lower age group were associated with increased odds of having optimal
academic performance score.
Discussion
Using the DAPT, 28.9% of the pupils had Optimal IQ, 37.8% had borderline IQ and 33.3% had subnormal
IQ in our study. A similar observation was made by Ejekwu et al in Enugu [14]. This finding was in contrast
with that of Ijarotimi and Ijadunola in Akure who reported that 64.2% had intellectual deficit [28]. This
could be due to different psychometric tool used (Ravens progressive matrix). The study conducted in Akure
was done among 402 students aged 10-15 years. The children were older and sample size for the study was
smaller than our study. The high social class and good educational level of the parents of the pupils had a
positive impact on intelligent quotient of the pupils [29]. Similar findings were made by Ebigbo and Izuora
in Enugu [16], Ijarotimi and Ijadunola also had similar result in Akure [28]. This is because poverty with
its consequential effects contribute to the lower IQ among pupils in the lower social class. Also, educated
parents usually takes decisions that will enhance mental and physical development of their children [29].
This study revealed that pupils from private schools had better IQ and academic performance compared to the pupils from public schools. This was similar to findings of Millones and Leeuwen in Peru [29]
who also documented higher scores on Ravens among private school pupils. This may be due to the social
background of the pupils in private school since the pupils from private school are usually from well to do
family who can afford the school fees in the private school [19]. The pupils-teachers ratio in private school
is less than that of public schools and the private schools are also better equipped for effective learning. It
was observed in this study that the malnutrition (stunting and underweight malnutrition) pupils had lower
IQ and academic performance. These observations were in agreement with those of Ejekwu et al [12] which
recorded association between malnutrition and impaired cognition. Survana and Itagi in India [20] and
Grantham-McGreggor [29] had also reported low intelligence in malnourished children in their studies. In
the present study, wasted and thinned pupils had significant association with lower IQ but not with academic
performance. This work is in agreement with previous researchers [12-14]. This is because Wasting/thinness
is a reflection of an acute or current malnutrition which may not have as much effect on cognitive function
as stunting which is a reflection of chronic malnutrition [30,31]. Contrary to the findings from our study
and some earlier studies [13,14, 30,31], Ijarotimi and Ijadunola in Akure [28], reported the absence of a
significant association between nutritional status and IQ. However, stunted pupils performed worse in the
IQ tests compared to the well-nourished subjects in the same study [28]. Higher IQ was observed in younger
age group 5-7 years compared to age 10-11years in this study. This was in consonance with other studies
[12-14,30]. This result was in contrast with the report of adedeji et al in which undernourished pupils with
impaired intelligence were more under the age of 9 years [32]. This could be attributed to obvious nutritional
neglect usually suffered in early childhood by the children in Jos, Northern Nigeria where Adedeji’s study
was done. Also, as children grow older they tend to be more distracted and lack concentration as more non
curricular activities attract their attention especially in pre-adolescent and adolescent age group. It was also
observed in our study that undernourished children with poor socio-demographic variables had a greater
prevalence of subnormal intelligence when compared with those of their undernourished counterparts who
had a good socio-demographic background. This is similar to the findings in previous studies [11,19,21],
who reported that unfavorable socioeconomic factors adversely affect under nutrition and intelligence [33].
Conclusions
Stunted and underweight pupils had higher association with subnormal intelligence and poor academic
performance. Socio-demographic factors such as age greater than 10 years, public schools attendance and
lower social class, low parental education are factors associated with a greater occurrence of poor cognition
among the undernourished children. Hence, good nutrition and improved socio economic factors will assist
to improve cognition among Nigerian pupils especially in early years of life.
Acknowledgement
We acknowledge the parents of the pupils, the head teachers, the teachers and the pupils in the schools used
for this study in Ilesa for their cooperation. We also acknowledge the Zonal Inspector of Education who
gave us the permission to use the schools for the study.
Authors’ Contribution
All the authors contributed in concept, design, definition of intellectual content, literature search, clinical
studies, data acquisition, data analysis, statistical analysis, manuscript preparation, manuscript editing and
manuscript review. The manuscript has been read and approved by all the authors.
Conflict of Interest
No conflict of interest
Bibliography


Hi!
We're here to answer your questions!
Send us a message via Whatsapp, and we'll reply the moment we're available!