Biography
Interests
Enas S. Abbas, Hassan A. Shora*, Hoda A. Abdel Salam & Enas F. Elngar
Department of Pediatrics and Department of Nutrition and Food Science, NNI, National Nutrition Institute, Port-Said university and Suez Canal University, Egypt
*Correspondence to: Dr. Hassan A. Shora, Senior Research Scientist, Head of Medicine & Diabetes Center, Port-Said University & Ismailia General Hospital, Egypt.
Copyright © 2021 Dr. Hassan A. Shora, et al. This is an open access article distributed under the Creative Commons Attribution License, which permits unrestricted use, distribution, and reproduction in any medium, provided the original work is properly cited.
Abstract
Nutritional habits are very important regarding the healthy status of female primary school children.
This study aimed at identifying the nutritional habits of female primary school children and their
relationships with anthropometric, sociodemographic, physical activities and overweight/obesity.
A cross-sectional study that included 200 female primary school children aged 6-12 years who
attended the pediatrics outpatient clinic of National Nutrition Institute, Cairo, Egypt. The
participants were randomly selected from January to June 2020.
For each child sociodemographic data, nutritional habits, dietary food intake, physical examination and physical activities. Dietary analysis was done for essential micronutrients, iron, calcium, riboflavin, retinol, thiamine, and vitamin C levels.
Obesity was prevalent in female school children 34.5%, eating food snacks while watching TV
representing (87%), of obese children, with positive correlation between obesity and taking snacks
between meals (91.8%) in girls of obese children. However all girls in this study used to take
junk snacks. The main items of these snacks were unhealthy fast foods. Only a small percentage
of studied girls ate vegetables and fruits 29%. Inadequate intake of riboflavin in 54.2%, thiamine
32.8%, iron 22.1% and calcium 18.4%.
This study demonstrated that eating while watching T.V, unhealthy snack consumption increased
intake of the refined CHO food supply in the form of processed grain, soft drinks, sweeteners and
lack of physical activity was the most important contributory factors of obesity among primary
school female children.
Introduction
The era of intense development is childhood. It is the time in which the development of the individual’s
growth rate has increased rapidly [1]. The primary school years (6-12 years) were recognized as a crucial
time for an increase in the Z-score index of body mass (BMI) [2]. Children’s nutritional status and dietary
patterns are effective and have negative effects for the individual’s health [3]. Childhood healthy eating and
physical activity are important for good health, growth and development [4,5], and unhealthy diets and lack
of physical activity raise the risk of children being at risk of obesity and associated health difficulties [6,7].
Dietary Effects of Globalization and Urbanization: A rapid rise in the intake of highly processed/energydense foods with low nutritional value has been determined by trends. The dietary effect of Globalization and Urbanization, a rapid rise in highly processed consumption has been determined by trends. In addition to ready-to-eat products [8-10], this contributes to the deterioration of dietary habits, especially among young people. With the concerning increases in overweight and obesity in teenagers, young people’s eating habits warrant special consideration not only because of the direct effects on weight status [11], but also increased risk in adulthood of cardio-metabolic disorders, such as diabetes type 2, hypertension, metabolic syndrome [12], and the impact of obesity on increased mortality risk and shortened life expectancy are also seen in studies [13].
A greater prevalence of chronic non-communicable diseases from childhood to adulthood has been linked with the change to Western dietary patterns [14]. The most important factors affecting the status of obesity and wellbeing during childhood are most of the non-communicable diseases embedded in childhood, balanced diet and eating habits, nutritional status and breakfast intake. The most effective factor is the weight status of the child [15]. As defined by the World Health Organization, healthy nutrition is a “cornerstone of good health” [16]. Good healthy diet is a significant prevention of obesity in children and their youth [17], as children are rising at this particular age and require sufficient and healthy nutrition in order to have appropriate growth conditions [18]. School children are often more involved, so they need better nutrition more often [19]. There is solid evidence that insufficient nutrition is associated with impaired growth and slow mental development [20].
Consumption of plant-based foods, in particular fruits, vegetables and legumes, is considered a healthy habit among food behaviors because of the potential for overweight and obesity prevention and some noncommunicable diseases [21,22]. A balanced diet at a young age ensures enhanced growth and health status in adult life [17]. Daily consumption of breakfast will be an effective cure for sufficient calorie intake and a balanced lifestyle later at a younger age [23]. International dietary targets for consumption of fruits and vegetables (F&V) (400g/day) have been set because of their impact on disease prevention and health status maintenance [24]. Skipping breakfast can also indirectly impact the academic performance of children, which means that if children considered breakfast intake at this age, the risk of obesity will be significantly reduced [15], which is an obstacle to students’ academic performance [25]. Since the nutritional status and dietary habits of children may be effective and have negative implications for the health of the person [3], regular consumption of breakfast is recommended at various ages, especially in early childhood [26].
Aim of the Work
The current study designed to assess the nutritional status and dietary habits of the female children in the
primary school age stage.
Subjects and Methods
It is a descriptive cross-sectional study performed to assess the nutritional habits of some of the primary
school-age females’ children of 6 - 12 years old who have attended the Pediatric out clinics of the National
Nutrition Institute in Cairo, for dietary advice.
- Female children in the primary school age of 6-12 years old
- The parent of children accepted to enroll in the study
- Medical records contain three separate 24 hrs recalls of daily intake of the children and a food frequency
Questionnaire.
- Female children who had any chronic systemic diseases, diabetes, heart diseases, chronic malabsorption,
gastrointestinal diseases, kidney disease, and food allergy excluded from the study.
The study included 200 participants of female children in the primary school stage aged from 6 - 12 years
old. Simple random selection performed to enroll the participants of primary school female children who
have attended the Pediatric outpatient clinic of the National Nutrition Institute, Cairo, Egypt, for a period
of six months from January to June 2020.
The female children asked to take off the heavy clothes, shoes, and belts during the anthropometric
measurements, the height-for-age, weight for age, and body mass index (BMI) for age Z-scores of WHO
growth references curves of specific age and sex used [27]. The series of three measurements done and the
average for each female child calculated. The data plotted on WHO growth reference curves.
Weight was measured using a platform scale; the scale was standardized by known weight before the use in
each studied site and corrected according to the test. The subject was standing barefooted with light clothing
on the center of the platform without touching or leaning on anything and the weight measured to the
nearest 0.1kg.
Weights status was determined according to Z-score reference growth curves of the World Health Organization [27], and categorized into:
Normal weight range from - 2 SD to + 2SD
Underweight < - 2SD
Overweight > + 2SD
Obese > + 3SD
Standing Height recorded using the raven minimeter, with direct reading of height with an accuracy of
+/- 0.1cm. It was on the floor with the back resting against the upright to which the minimeter if fixed.
The child was placed barefooted on a flat surface, with weight distributed evenly on parallel feet with heels,
buttocks, shoulders, and back of head touching the wall. The head held comfortably erect so that the line of
vision of the outer border of the orbit with the external auditory meatus in the same horizontal plane was
vertical on the body. The measuring arms are brought down on the subject’s head with the back plate tightly
against the wall head. The red cursor line was giving the accurate height measurement. The height measured
to the nearest 0.1cm.
Heights status was determined according to Z-score reference growth curves of the World Health Organization WHO [27], and categorized into:
Short stature < - 2SD
Normal height range from - 2SD to + 2SD
Tall > + 2 SD
BMI calculated by the equation of the weight (in kg) divided by square of height (in meter), then result of
the equation of each female child put on the age and sex-specific BMI Z-score growth curves of the World
Health Organization [28], classified as:
Normal BMI range -2 to + 2 SD
Over weight: BMI> +2 SD
Obese: BMI > +3 SD
Underweight: BMI < -2 SD
Informed written consent signed from both parents of participants obtained.
Methods used for measuring food consumption of eligible children classified into two major groups. The
first one, known as the quantitative daily consumption method, consists of recalls or records designed to
measure the quantity of foods consumed over one day periods ‘’ twenty-four hours recall’’ method. The
second method included the dietary pattern (Food Frequency Questionnaire).
1) The first one is twenty-four hours recall (24hrs recalls) used for three separate days, including the holiday, school day of female children, and during the shopping day with their mothers or families over the last week. Twenty-four hours recall taken from every child’s mother or the child according to her age to calculate the range of quantities of daily food consumed over one day period of the three separate days. The quantities of food consumed were estimated in the household measures by grams and achieved by the using of the pre-prepared list of weights of commonly used household measures in Egypt developed by the National Nutrition Institute. The food composition tables (FCT) of Nutrition Institute [29], used to determine the energy and nutrients child intake’s of each adequacy of the diet consumed and assessed by comparing these energy and nutrients intake of the child with her recommended dietary allowances of age and sex ‘’RDA’’ [29,30]. Sight and life / Newsletter [31], a food Coding system was used based on 2 digits denoting food group, 2 digits denoting food items, and 2digits denoting the method of preparation analysis of grams of food and beverages to energy and nutrients carried out by computer with a certain program.
2) The second method included the dietary pattern, food frequency Questionnaire. This method used to give qualitative descriptive information of the dietary patterns of primary school female children who recruited in the study about the food groups in the last week:
· Protective groups as fruits, vegetables either fresh or cooked.
· Energy food as cereals and fat, tubers, and sweets.
· Bodybuilding food: animal and plant protein as egg, fish and meat, chicken, legumes, milk and its products.
The questions asked about dietary habits as the frequency of meals per day, eating breakfast, fast-food meals,
and eating vegetables and fruits per day.
The continuous variables estimated in means & standard deviation (± SD), While the categorical variables
estimated in frequency, percentage, and proportion. The estimated energy requirement (EER) calculated
for every female child using age, sex, height, weight according to the Institute of the Medicine Dietary
References intake equations. One-way ANOVAs test used to compare means of continuous data. Chisquare
test used to compare differences in the distribution of frequencies and categorical data among groups.
All analyses conducted using SPSS version 21 [32]. The p-value < 0.05 considered statistically significant. The level of significance for all analyses was 2 sided and set to 0.05.
Results
Table 1 shows that the children of family size more than 5 constituted 68%, and the rest of children 32% are
of family size less than 5members. As regards distribution of children body mass index 34.5% are children
obese and non-obese are 65.5%.
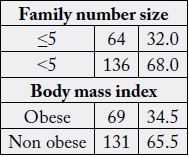
Table 2 represents food habits of 200 of primary school female children. The majority of females 63.5% said that lunch is the main meal, and 20.5% take dinner and 16% take breakfast. Also the obese children take breakfast (17.4%), lunch (68.1%), and dinner (14.5%). The study revealed a high percentage of the females take snakes in between meals (84.5%) all obese children take snakes (100%).
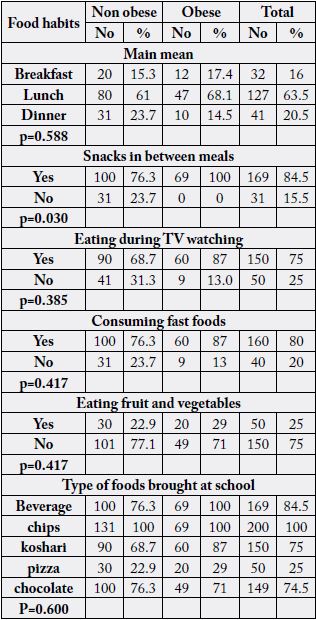
Most of the female children (75%) are eating during T.V. watching. Also, obese children eat during T.V watching (87%). Also, female children eat (80%) consumed fast food. The obese children take (87%) fast food. About one quarter only (25%) eat fruits and vegetables of the obese children eating fruit and vegetables (29%).
The majority of female children brought beverages and chips (84.5%). The majority of females brought koshari (it is traditional food in our country consist of the rice, macaroni and lentil cooked by oil, about 400- 500kcal in small plate), and chocolate (75%, 74.5%) respectively. A few of them brought pizza (25%). Table 2: shows that the daily energy and nutrient intakes of obese children are statistically significantly higher than those for non-obese children.
Table 3 shows that the energy intake as a percent of RDA of the obese children is statistically significantly higher than that of non -obese children (p<0.0001). All the obese children consume 100% of RDA or more of energy. Also shows the protein intake as a percent of RDA of obese children is not statistically significantly different from that of non-obese.
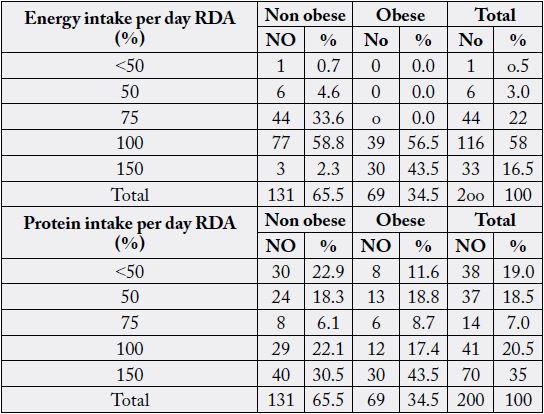
Table 4 shows that energy intake as a percent of RDA among obese children is statistically significantly higher than that of non-obese children with p- value (<0.0001). All obese children consumed 100% of RDA or more. Also, the table shows that protein intake as a percent of RDA among obese children is not statistically significantly different from that of non-obese children.
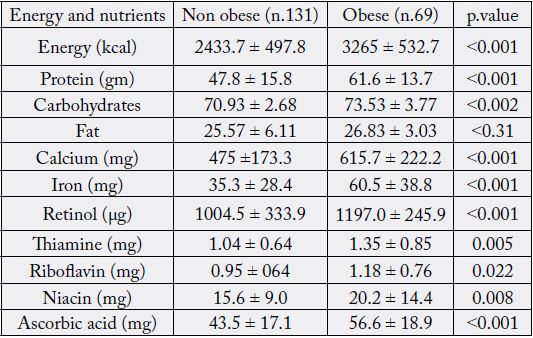
Table 5 shows the dietary adequacy of food item among non-obese female children. This might have reflected the inadequate intake of riboflavin (54.2%), thiamine (32.8%), iron (22.1%), and calcium (18.3%).
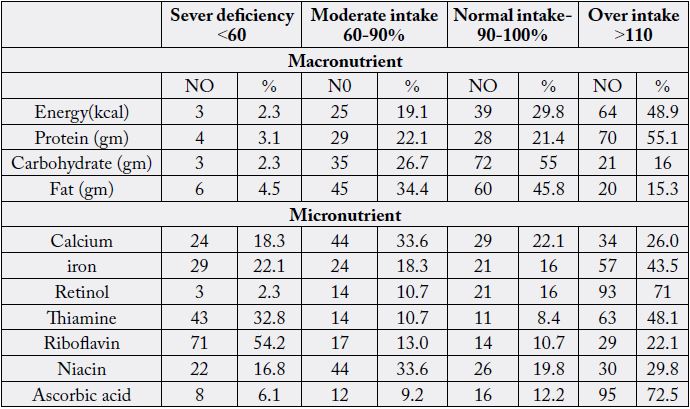
Table 6 shows that most obese children (94.2%) received more than their energy requirements. Also (82.6%) of children have more than 110% of their RDA of protein. The micronutrients of mineral intake (calcium and iron) found to be deficient in some obese children. Also, vitamins, as thiamine; riboflavin, and niacin are also deficient (21.7%, 40.6%, and 14.5% as percent of RDA (respectively).
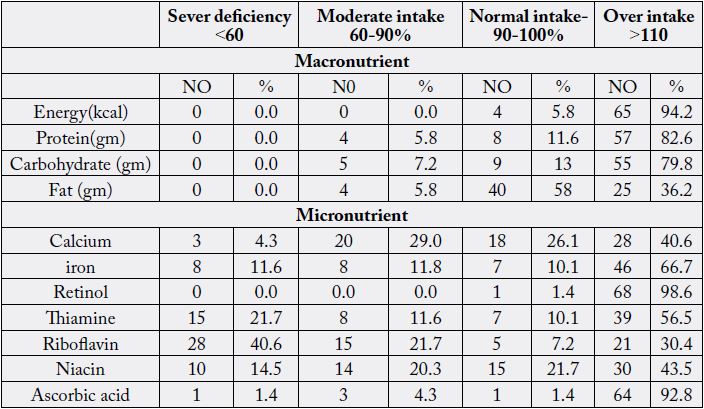
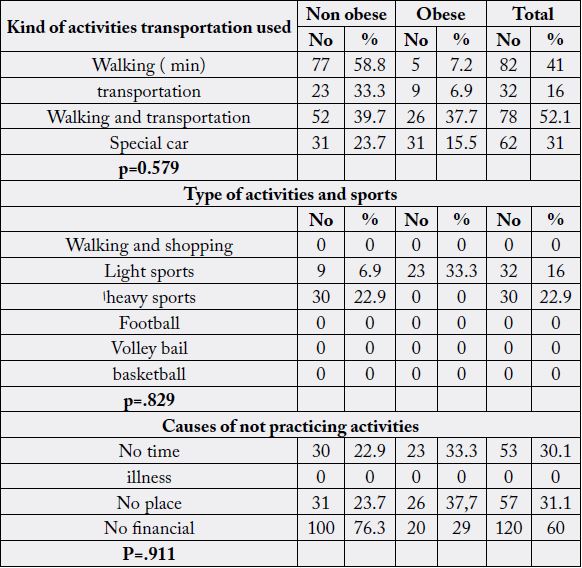
Table 7 shows that the physical activity of studied children including the walking to school, the housework practicing activities and according to types of activates, hours in practicing activates, frequency of practicing sports .kinds of activities transportation used for obesity (walking-transportation-walking and transportation -special car) the percent of obesity (7.2%-6.9%-37.7%-15.5%) respectively, and the type of activities and sports (walking and shopping-light sports-heavy sports-football-volley ball-basketball (0%,33.3%,0%,0%,0%, respectively), and causes of not practicing activates (no time ,illness, no place, no financial (33.3%-0%,37.7%,20%, respectively).
Discussion
In the development of the child’s consciousness and identity, primary education is an essential step. It is
known to be an external bridge [33]. Children are remarkably curious at this stage of advancement, and
primary education must promote this tendency among children from different racial, cultural, and socioeconomic
backgrounds [34].
Genetics and diet may be dependent on the differences that occur in children’s early developmental abilities [35,36]. Educational and behavioral strategies are required to adjust the dietary habits of children in primary school.
Globally, the number of overweight children estimated in 2010 to be over a 42million, close to 35million of them living in developing countries. The prevalence of obesity is increasing. It is essential to trace certain aspects of lifestyle that predispose to obesity [37]. We conduct a cross-section of a discretional study on primary school female children to found the relation between food habits, physical activity, and obesity.
Children’s dietary preferences and physical activity patterns are probably similar early in childhood. Several dietary factors were positively associated with a child’s overweight or obesity. The overeating of high-energy foods remained a risk factor for a child’s obesity [38].
In the present study the obesity represents (34.5%) among the primary school female children. We highlight the commonest pattern of potential contributory factor to childhood obesity, food references, and physical activity.
As regards food habits, eating while watching T.V taking snacks between meals. We found most obese females (87%) eating at watching TV. Most of the females were taking snacks between meals (100%). Our result is in line with previous study done by Hare B and her colleagues’ [39], she reported that the eating during watching T.V associated with increased obesity prevalence.
Snack taking is one of the important points that we assess in our study, we found that the main item of our children snacks was the unhealthy junk foods snacking. In the study, we found a positive correlation between obesity and taking snacks between meals (91.8%) in girls. Our finding supported with the previous studies carried in the USA in 2010 by Chum and these colleagues in which the majority of the girls take pocket money in school (39.9%) bought Biscuits (19%) chips (11%), beverage (10.5%) pizza (71%) nuts and (76%) chocolates.
Junk foods contain food additives, artificial coloring, and artificial colorings, and artificial flavorings. These additives enhance the color; flavor, taste, and texture that made the Kids are the target of the junk food industry. A negative effect of junk food on children is rapid weight gain, often leading to excessive weight and sometimes obesity [40].
Individual adiposity is the result of a complex interplay among genetically determined body habits, appetite, nutritional intake, and environmental factors [41]. There is clear evidence that marketing influences the children’s requests. They are regularly targeted with calorie-dense, nutrient-poor food making a trap to obesity. There is a lack of exercise and no walking or jogging or cycling, which together makes them victim of the obesity epidemic [42].
In this study, the fast-food consumption assessed, we found that obese children consumed (87%) fast foods. The study assessed the eating fruit and vegetable consumption and found that obese children consumed (29%). Beverage consumption leads to obesity due to its influence on lipogenesis of insulin secretion or leptin production [43]. Healthy snacks considered to be a part of a healthy diet food are low in saturated fat, cholesterol, high fiber foods including whole-grain foods, vegetables and fruit foods, and a moderate amount of sugar and salts, calcium-rich foods, iron-rich foods to meet a child’s daily requirement for essential nutrient.
Parents should pay attention to the content of meals. Meals without vegetables and desserts may increase the intake of high-energy-density food [44]. Missing salads and desserts may also reflect the families’ socioeconomic status [45].
The rate of eating is one of the determinant factors for developing obesity [46]. Obese children eat faster and failed to show the normal pattern of slowing down the rate of eating towards the end of the meal.
The data confirm the importance of breakfast and the composition of meals in addition to meal frequency. In our study, we found that the majority of the girls (88.4%) take more than three meals per day not escaping one meal. And lunch was the main meal, and breakfast consumption suggested associating with lower BMI in children [47].
According to previous studies, there was a negative relationship between high consumption breakfast rates and high BMI, the less eating breakfast, the more obesity would find [15,48, 49] few studies have found that there is no significant relationship between breakfast and obesity or overweight [50].
Despite possible higher daily energy intakes in breakfast consumers, regular breakfast eating may lead to more regular eating habits, and healthful food choices, which may contribute to a reduced body mass index. According to previous studies, skipping breakfast may also be related to dieting and disordered eating.
Sarhan et al., [51], who stated that the mean caloric intake of obese students was 3230 calories, as compared with 2489 calories of non-obese students.
Abd EL-Shakoor [52] concluded that female students consumed a smaller amount of energy. Dietary energy is an important consideration in obese and must be adequate for growth and type of effort but not so excessive as the cause obesity [53]
Physical activity has to be a successful method for obesity prevention. Healthy people 2000 calls for increased community availability and accessibility of physical activity by the center Disease control and prevention recently recommended that comprehensive school and community programs developed to promote physical activity among children [54].
In this study, we correlate physical activity and obesity as contributing factors and found that a substantial difference between the level of physical activity in obese and non-obese children. These results found that walking to school was less among obese children compared to non-obese.
Our study is coincident with the previous studies in Norwegian England that found that those walking or Cycling to school were commoner in non-obese than obese children [55].
Conclusion
Our study concludes that the eating during watching T.V, and an unhealthy snack consumption, increased
intake of the refined CHO food supply in the form of processed grain, soft drinks, sweeteners and lack of physical activity are the most important contributor factors of obesity among primary school female children.
So the educational and behavioral strategies are required to adjust the dietary habits of children in primary
school.
Bibliography


Hi!
We're here to answer your questions!
Send us a message via Whatsapp, and we'll reply the moment we're available!